What is Trading Doggy Style?
A Little More Detail on How I Trade
This is a re-send from February of this year and will serve as a lead-in to some upcoming content in the next couple of months.
It is often said that there is nothing new in markets, and this is broadly true. Different traders have different styles and approaches and keep different tools in their toolbox. Most traders have a specific style they employ based on a specific foundation, while some use a more discretionary/blended approach. Just a few examples include classical pattern and indicator based technical analysts, pure price action trading, and order flow trading with or without volume profile analysis.
My personal style is a blended approach. Over the years I have taken aspects of different approaches and combined then in a manner that I believe allows me to identify high probability trades with an extremely large R (reward to risk). I generally don’t concern myself with where the market may be going in the next 6 months or two years (and for day trades even the next day), but I do know where I can initiate a position to have very well-defined risk with a potential for outsized gains. I apply this approach to investing, swing trading, and to day trading.
I’ll first provide an example of what I mean by managing risk at an area of interest, and then get into my style of trading and how it allows me to identify these areas.
Buying AMD 0.00%↑ at the SPY 0.00%↑ October 2022 bottom:
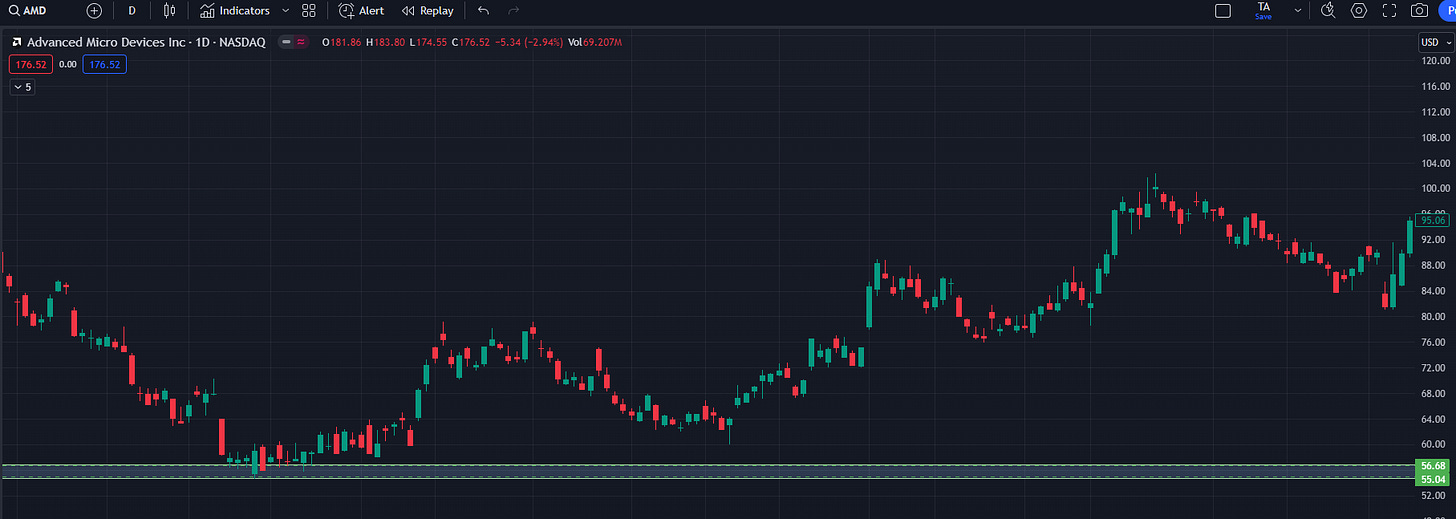
I was aggressively adding long exposure to my portfolio in the 3500s during the 2022 rates bear market. Did I know with certainty that we would bottom there? I did not. However, I knew exactly where we were going next if we proceeded lower, and I knew exactly where we were going next if it held. I identified those companies to which I wanted significant exposure, and initiated entries that also had very clear and defined risk. I’ll use AMD as an example as it was at the top of my shopping list for 2022:
My area of interest for the index (Using ES so SPX levels will differ slightly) was 3587 (3554-3587). I had no way to know with 100% certainty that this would be the bottom, but I knew that we were going to 3220-3240 if this area didn’t hold. I would simply exit positions for a small loss and re-evaluate in the 3200s
You can see there was not a single daily close below 3587 and in fact on that CPI print price spent less than 2 hours below it and was a straight rocket off the lows in the most beautiful swing low I’ve possibly ever seen.
AMD had arrived at my area of interest the same week of October 10th, 2022. I had been patiently waiting for the $55.04-$56.68 range.
There were no daily opens or closes below $55.04 and only the briefest intraday excursion below it, forming what is called an excess low which actually strengthened my conviction.
I’ll reiterate. I had no way to know with 100% certainty that the index and AMD 0.00%↑ would bottom here. But I knew that AMD was going to $47.24 at minimum if this area didn’t hold. I also knew that if both the index and AMD did hold these areas, then there was a very high probability that I was buying a generational low on AMD.
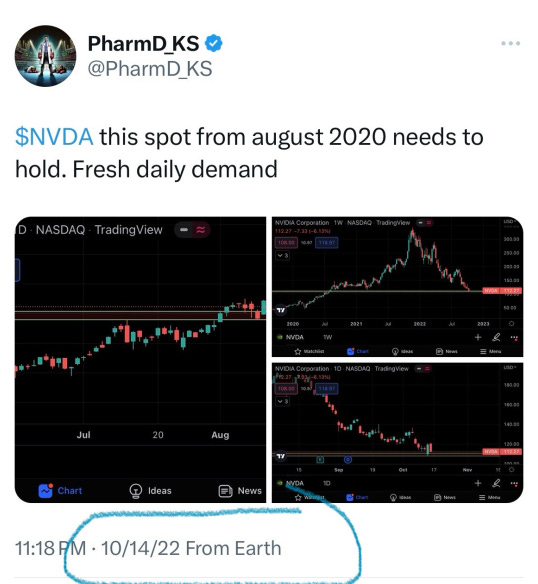
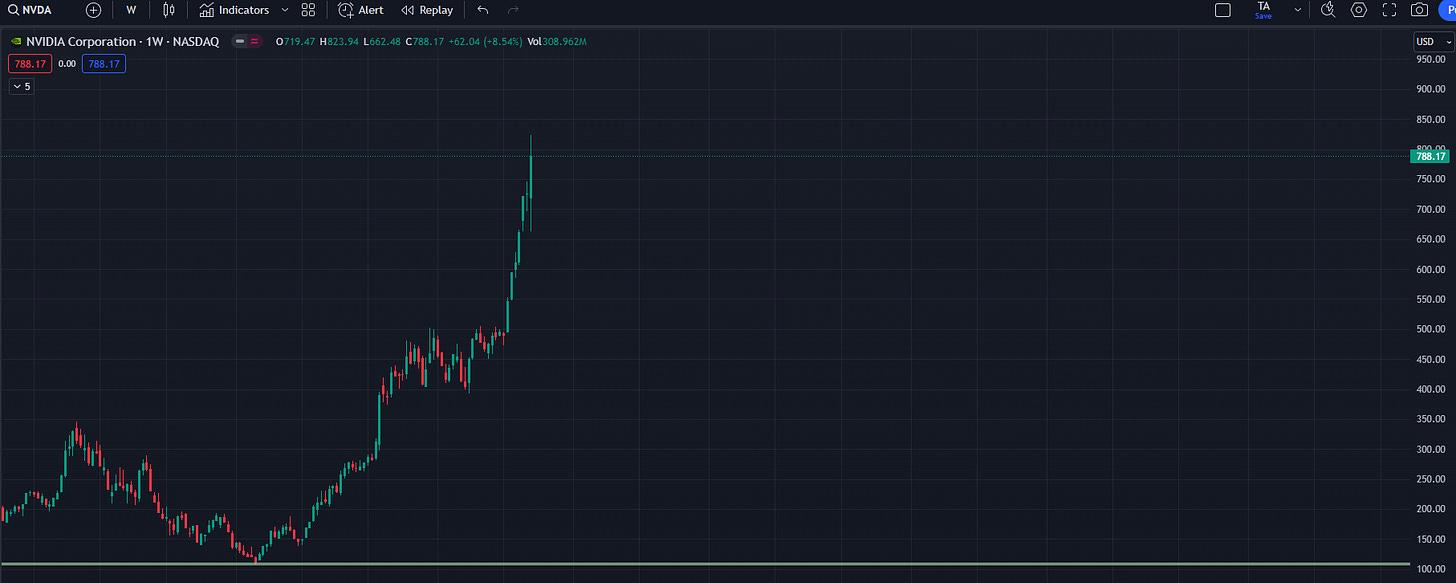
NVDA 0.00%↑ was a similar trade setup for what it’s worth and clearly in hindsight I chose the wrong one to weight more heavily. We were nowhere near “AI mania” starting and I won’t pretend like I knew that was coming.
So what then goes into Trading Doggy Style?
SUPPLY AND DEMAND AT PRICE
Supply and Demand ultimately drive the prices of everything. You will see supply and demand in financial markets described a number of different ways. What I call “Supply and Demand at Price” is something a bit different (though I do not claim it to be fully unique to me). I am identifying prices or a specific range at prices at which there was a significant mismatch between supply and demand. I am looking for those areas that, since the mismatch occurred, have not traded again. I call this “fresh” demand or supply. These areas can be identified on any timeframe. On higher timeframes the strength of the area will be greater, and on lower timeframes precision will be superior. Using multiple time frame analysis of supply and demand at price I can identify an area where I can have a precise entry that is likely to elicit a strong response. In addition to identifying areas of interest, I also use real time intraday supply and demand at price to execute some (not all) of my trades.
VOLUME PROFILE ANALYSIS
Many newer traders get intimidated when they see a volume profile on a trader’s chart. They really need not be. Volume profile is simply another way to represent areas where there is agreement among participants in what prices are “fair” and what prices are not. It also can help us to identify mismatches in supply and demand and how the perception of value by market participants is changing over time. Even with a very basic understanding of volume profile one can readily identify an area where it might be optimal (or perhaps more importantly suboptimal) to initiate a trade. I use volume profile in three key ways:
Evaluate the development of perceived value by market participants over time and identify changes in that perception.
Identify areas that may be optimal (or suboptimal) to enter a trade or investment.
Monitor the progression of a trade or investment (assessing the strength of a trend) so I know if I should continue to hold or exit.
BALANCE RANGE ANALYSIS
The market is constantly shifting between periods of balance (consolidation or rest) and periods of trend (imbalance between supply and demand). Balance occurs on all timeframes. A given instrument may be in a balance (or trend) phase across multiple years, months, weeks, days, 30-minute periods, or even 1-minute periods. Once again, I apply multiple time frames to balance range analysis. I use balance range analysis to identify areas of interest, and I use balance range concepts to execute some (not all) of my trades and investments.
PRICE ACTION ANALYSIS
I am foundationally a supply and demand (at price) and price action trader. While I do discuss and teach certain price action patterns, it is more important to me to understand what a given price action represents. Knowing what an evening star pattern is, for example, is one thing. Understanding what it means to the relative positioning of market participants and its impact on their motivation to buy or sell is far more important. I use price action analysis in my own way, primarily to assess these factors. It helps me to identify the relative strength of participants (buyers and sellers) and to identify where one side may find themselves trapped. When participants are trapped offsides in a position (short and price is well above their entry or long and price is below their entry) their internal supply and demand curve shifts, forcing them to make poor decisions. They may be forced to buy when they really should be selling, or forced to sell when they really should be buying. I look to take advantage of these participants.
MARKET PROFILE and MARKET STRUCTURE
I primarily use select aspects of market profile and market structure to assess which set of participants maintains control, to assess the strength and maturity of a given trend, and to assess for potential changes in that trend. These aspects are meant to complement the first three components of my trading, and I do not consider myself a market profile trader. I have taken concepts from market profile and market structure and made them my own, often in ways which would likely make purists of those styles uncomfortable.
TRADITIONAL TECHNICAL ANALYSIS
I do use very select traditional indicators and very occasionally monitor static and dynamic support and resistance. However, the bulk of my trading does not rest on this and I am often using it as confluence in my trading decisions.
SUMMARY and CASCADING SETUPS
I use this blended approach to identify areas of interest with very well-defined risk that are likely to yield enormously positive results. I am specifically looking for what I call cascading setups. In general, these are setups where I know that A leads to B and B leads to C, and I have extremely tight risk with my entry for setup A. The setups are almost always some blend of supply and demand at price, volume profile, and balance range analysis. A general example of a cascading setup would be a situation where a hold of a given supply or demand at price (my entry) would trigger a market profile setup in my favor, which would then trigger a volume profile setup in my favor, which would then shift market structure in my favor. Thus, my entry successively triggers traders of different styles to “chase” price after I have executed, providing supportive flows for my position, and frankly ultimately providing me with exit liquidity.
A lot of what I write in my posts and discuss in the Discord live commentary can be foreign to newer traders. There is a wide range of backgrounds among members. I am often criticized for “giving away too much” of what I know, and I simply don’t care. Others knowing what I know will never prevent me from making money in the markets. I include this additional color (as opposed to simply providing a pivot and support and resistance) for the benefit of those who are further along their journey or interested in learning. Some newer traders may have no interest in learning my style and just want the trade setups. Those are there. Others may find themselves confused from information overload. Fortunately, the Discord is filled with extremely experienced and skilled traders that are very generous with their time in answering questions. Many of these are current students in the Trading Doggy Style course. The most successful members have taken the time to ask questions, review the video posts and resources in the Discord, and to spend the time reviewing my commentary at the end of the day and comparing it to the chart (and then of course asking more questions). Please feel free to ask questions and take advantage of the opportunity learn from the wonderful community of traders we have in the Discord.


