SPY 0.00%↑ QQQ 0.00%↑ IWM 0.00%↑ DIA 0.00%↑
As of the Friday close everything looks reasonably constructive in the indices, but into some big spots across the board
I’ll use the ES chart for SPY 0.00%↑ as it is a bit more conservative. ES tested its AVWAP off the RTH all time high and the 50sma. It closed just below its pre–March FOMC balance low of 5157 (SPY reclaimed it). There is certainly a good amount of supply above but grinding through that supply without failing back into range from the last 3 weeks is the bullish outcome. As always, we’ll discuss both bullish and bearish scenarios.
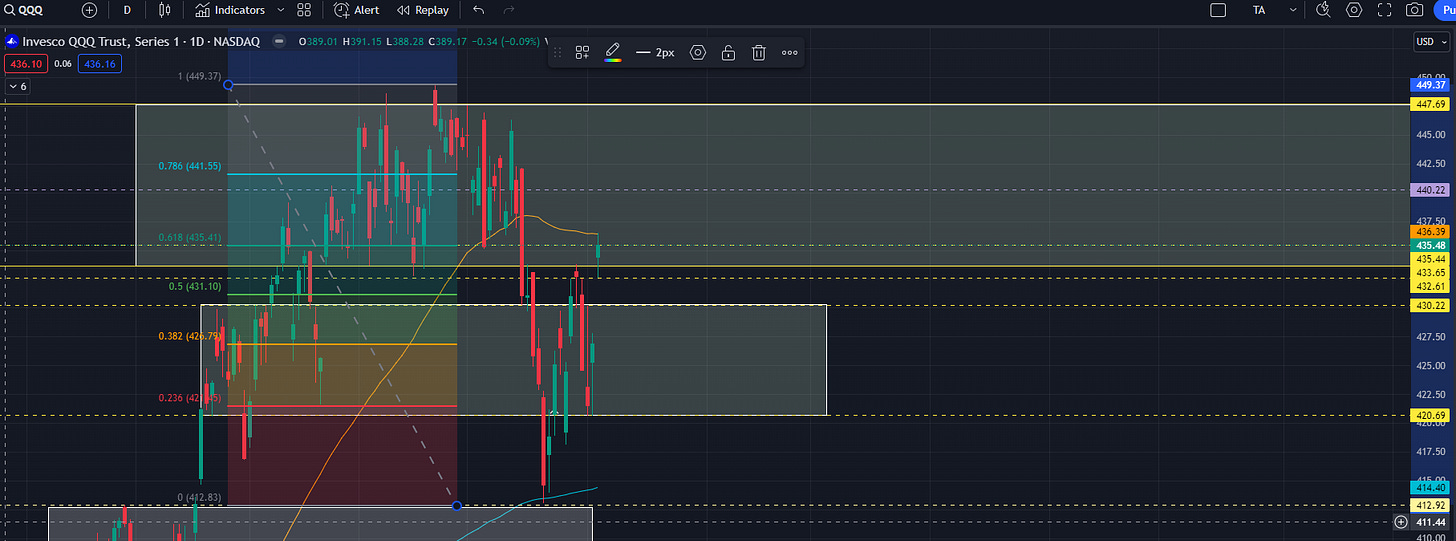
The QQQ 0.00%↑ chart has been an absolute money printer, so we’ll stick with that one. Again, there is a good amount of supply in this box. It stalled at its 50sma and closed right at the 0.618 retracement from the high to the low. Today’s low of day was a penny off the intermediary level I’ve been using between boxes, and closed right at the first level within the box that could potentially trigger a fail. Clearly basing within the box is the bullish outcome and failing back within the lower box is the bearish outcome.
IWM 0.00%↑ RTY stalled at it’s 0.618 retracement and closed just under the 50sma. Today’s low sitting just above the key 2018.1 level is promising. It cleared a decent amount of supply today and held reasonably strong in spite of it.
DIA 0.00%↑ YM stalled at its 50sma, 50% retracement, and top of a prior box. It has generally been quite strong since the hold of demand and the bottom of its lower box.
Be sure that you have read the free series I’ve started introducing Volume/Market Profile. I will continue to add archives of free content as it will be easier to find than searching for old Substack posts. You can find it halfway down the page at the following link PharmD Capital
The Trading Doggy Style course registration is back open. Learn more Learn to do it Doggy Style


