
Market Analysis for The Week of 8/17

If you are looking to join the Discord please see here: JOIN THE DISCORD Please email help@pharmdcapital.com if there are any technical issues. The daily and weekly plans are posted in the Discord so the Discord option includes Substack content, but a new Substack subscription does not include Discord access. There is a 15% discount with code CALVES15
Be sure you have read the Starter Kit, including the free section even if you’re a paid subscriber. Trading Doggy Style Starter Kit
This past week saw the breakout of the 6-week balance on ES, continuing the pattern of higher highs and higher lows and building value higher. I offered some criticism on X of the strength of this breakout and, while valid, perhaps we can forgive bulls their malaise after such a large and direct move higher from the bottom of the balance. It isn’t ideal to form fresh balance immediately after such a large breakout, yet ES has done just that. Additionally, NQ flashed some warning signs on Wednesday and remained quite weak the rest of the week. YM components were able to keep ES strong enough to make a new all-time high on Friday early morning and both YM and ES left ETH all-time highs (generally not any kind of topping sign). It is entirely possible for weakness to creep in without a “good” high, but the burden of proof remains on sellers. This week’s plan breaks down both the bull and bear cases for ES and NQ as their profiles are quite different. Sellers do have a window here, but there are a number of bear traps waiting lower as well. It should be an interesting week, and we will be prepared with both the weekly and daily plans.
PAID CONTENT BELOW AND IN THE DISCORD
If you aren’t in the Discord or otherwise don’t have the indicator script it can be found here: PharmD_KS Indicator. If you are in the Discord please see the TV-Indicator room
Add it to your favorites and follow the instructions (copy/paste daily and weekly levels into the respective sections).
ES Levels/Ranges:
6616-6619*
6597-6600
6579-6582
6566-6569*
6556-6559
6542-6545*
6523-6526
6508.75 ETH ATH
6502.5 RTH ATH
6496-6498*
6483-6486
6460-6463*
6451-6454 includes the 6-week balance high
6446 may produce a LBAF of the above
6431-6435*
6416-6419
6408.5 breakout day low. Carry forward
6392-6396*
6387.5 Reference 8/10 week RTH low
6375-6383
6369
6354-6357*
6345
6333-6335*
6319-6323*
6311
6302 reference 8/3 week RTH low
6292-6297
Will update if lower is needed
NQ Levels/Ranges:
24369-24380
24300-24310
24236-24248
24169-24183
24100-24112
24068.5 Excess all time high (a very good high).
24019-24028
23960-23980*
23869-23885*
23764-23785*
23700-23724*
23648-23660
23586-23600 includes 8/10 week rth low
23542-23551*
23485-23499*
23425-23438*
23396-23407
23329
23285-23298*
23220
23108-23121*
23087-23094* includes 8/3 week’s RTH low
23023-23046 includes 8/3 week’s ETH low
Will update if lower is needed
COMMENTARY:
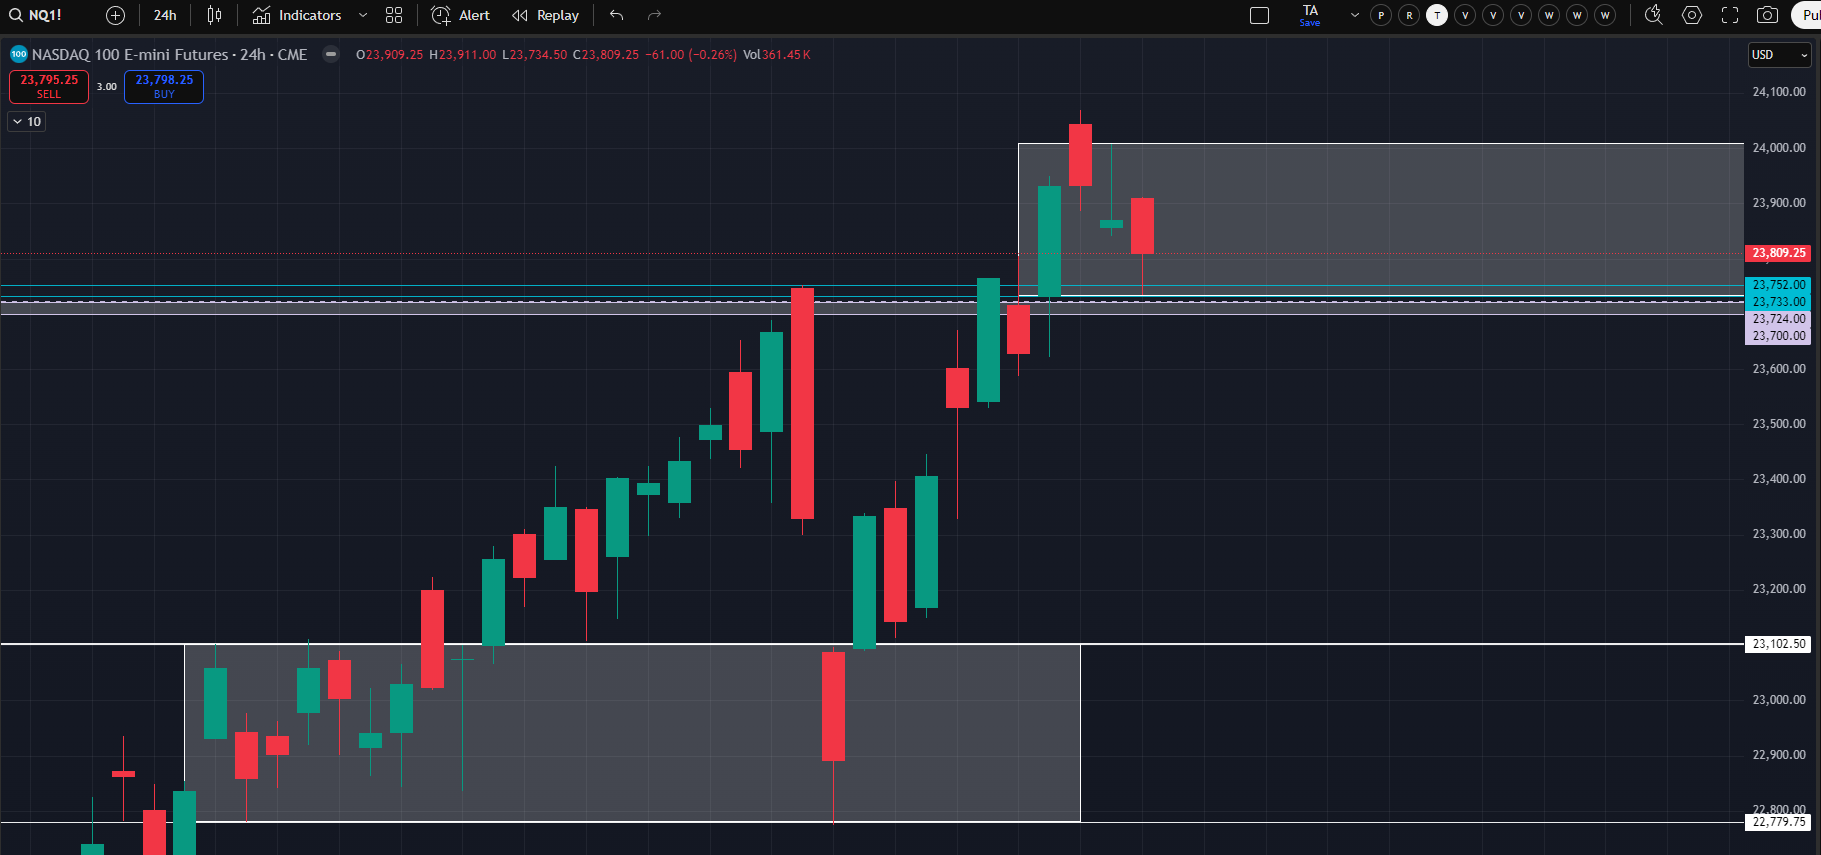
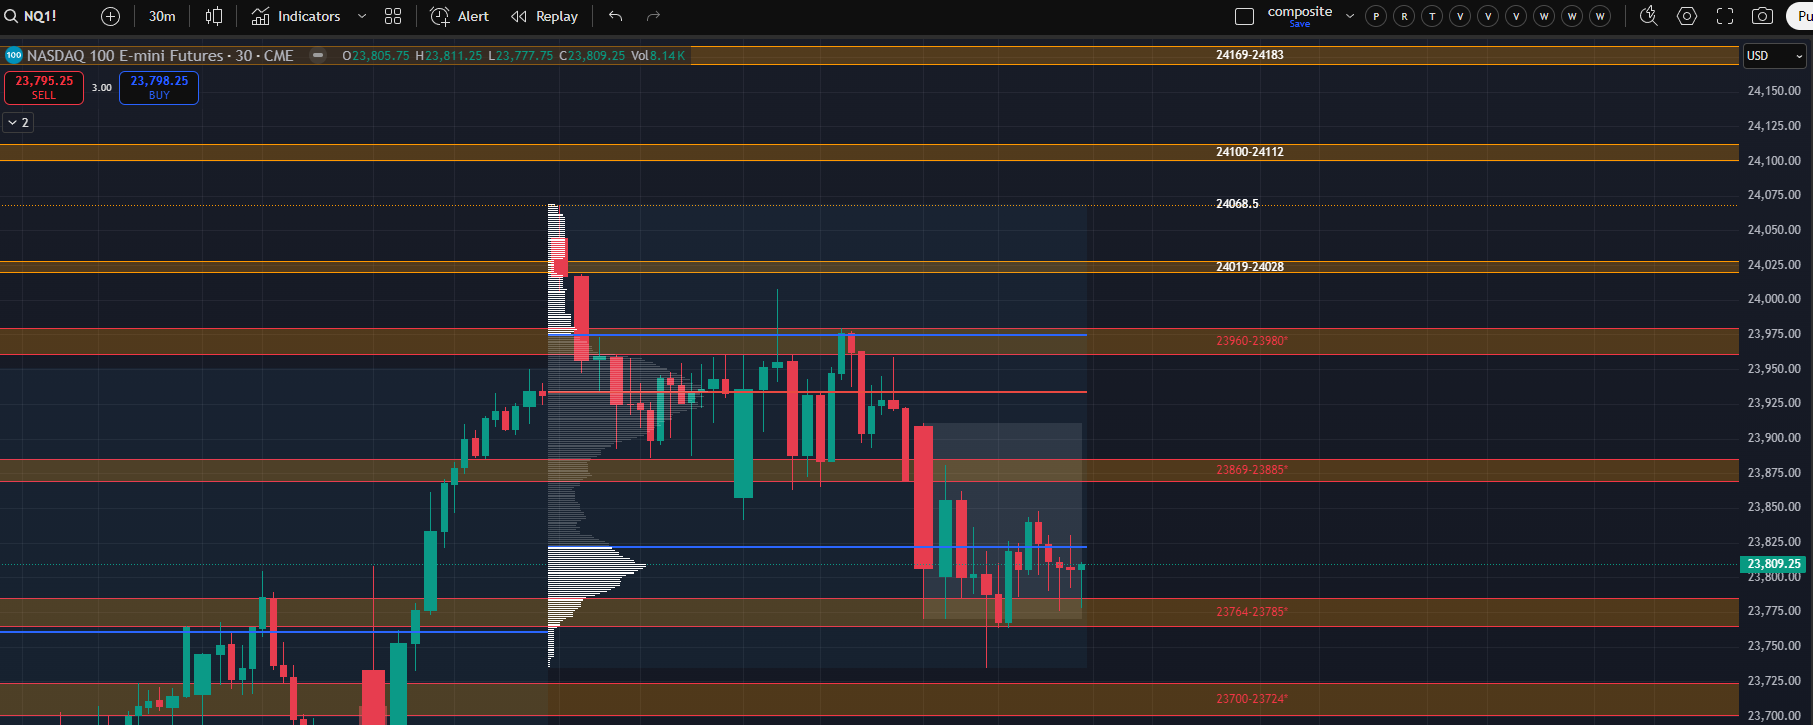
I’ll start with NQ because it is and has been the most important index for quite some time. The bull case is rather straightforward, and I’ll use a picture to illustrate this. Today’s low effectively held a back test of the July cash hours high and Tuesday’s open. This location, or even a quick sweep lower, could readily serve as a shallow daily higher low. Note this is a 24-hour RTH only chart if yours looks different:
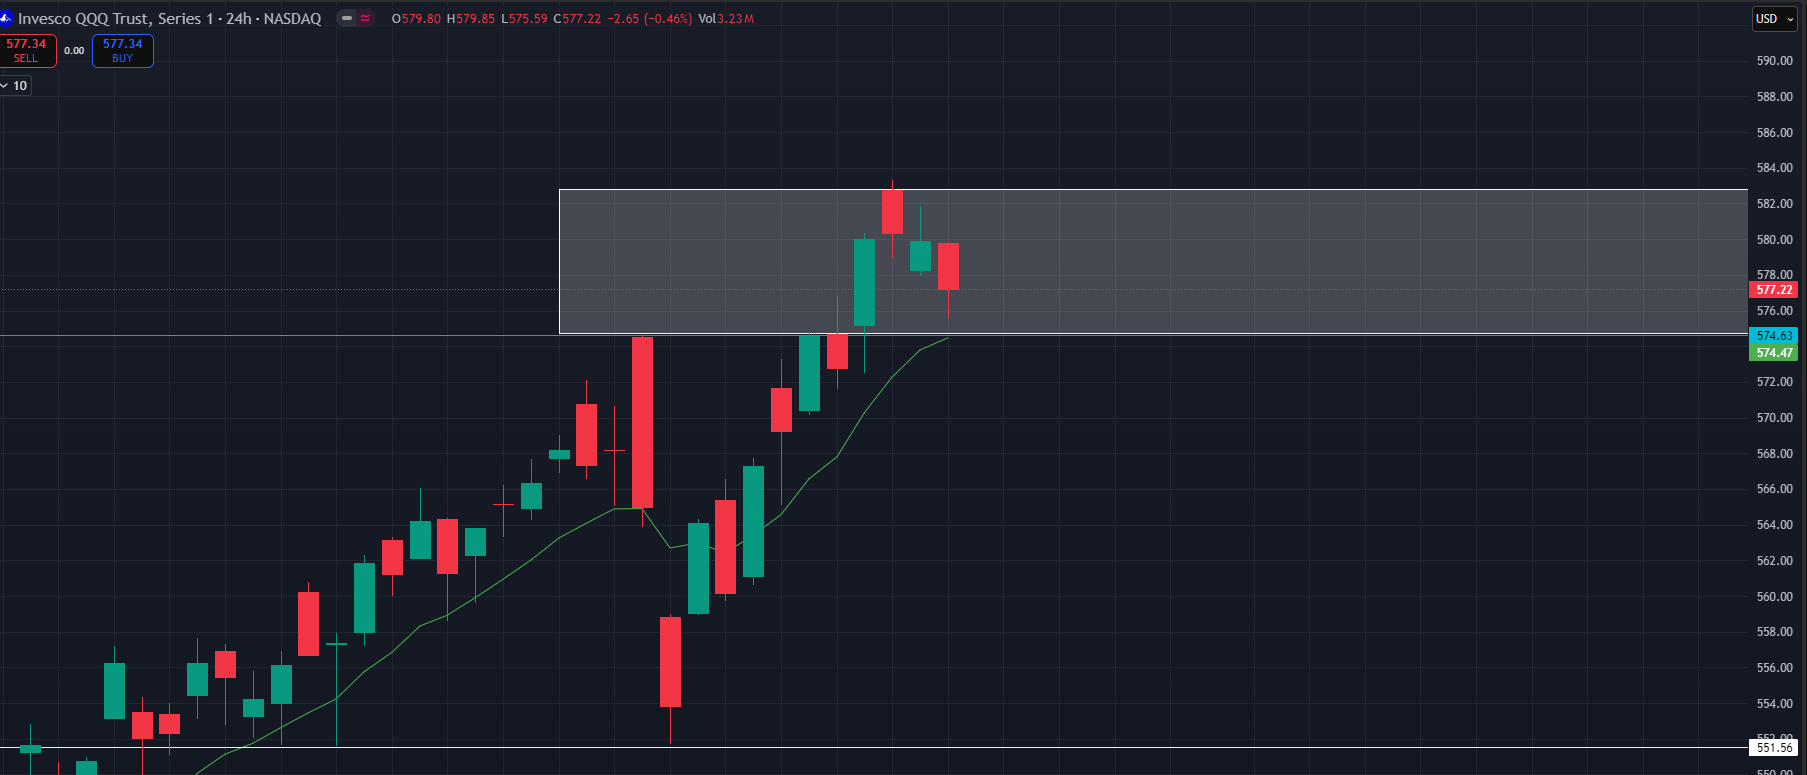
QQQ didn’t even make it to the July high so a quick sweep of Friday’s low works there as well. The rising 9ema sits there waiting.
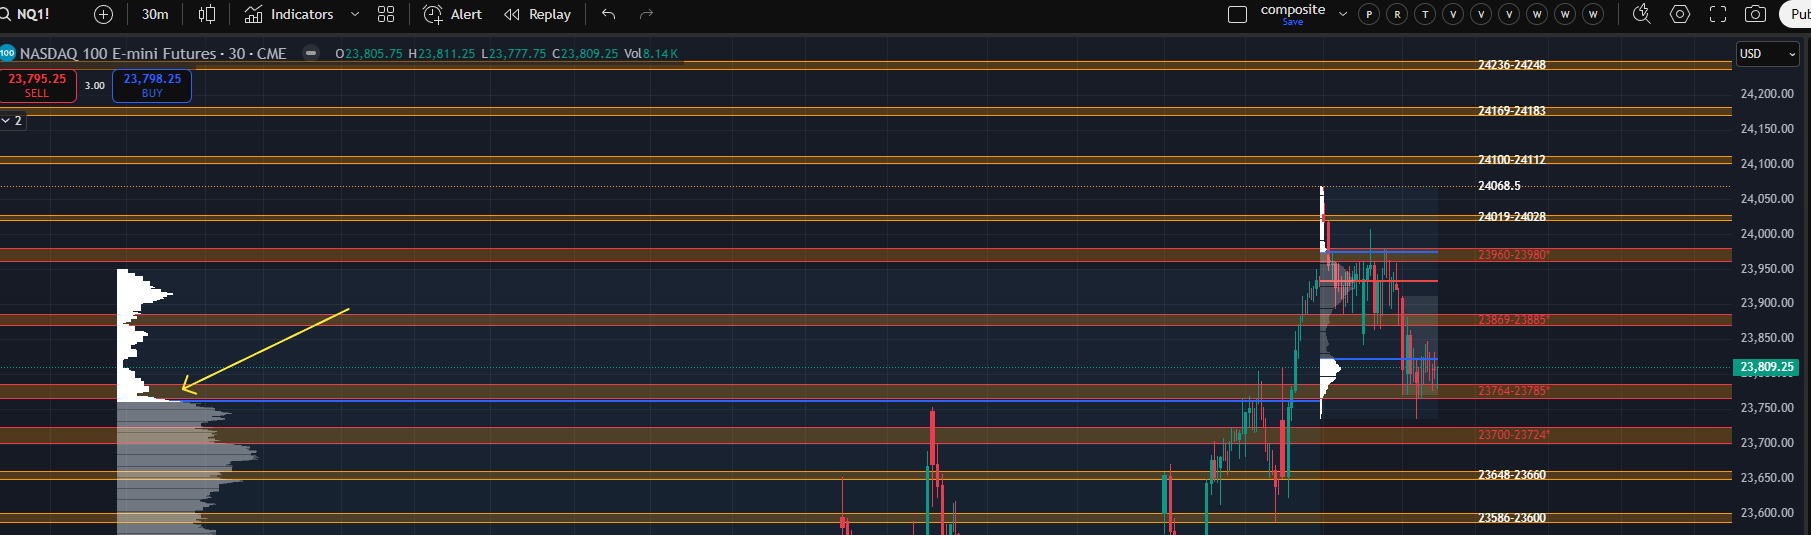
Additionally, note the location of today’s low on this chart with this week’s levels and two volume profiles. The profile on the left shows everything up until this recent high was made. Friday’s low, which had some excess, barely dipped into any kind of volume from that move up:
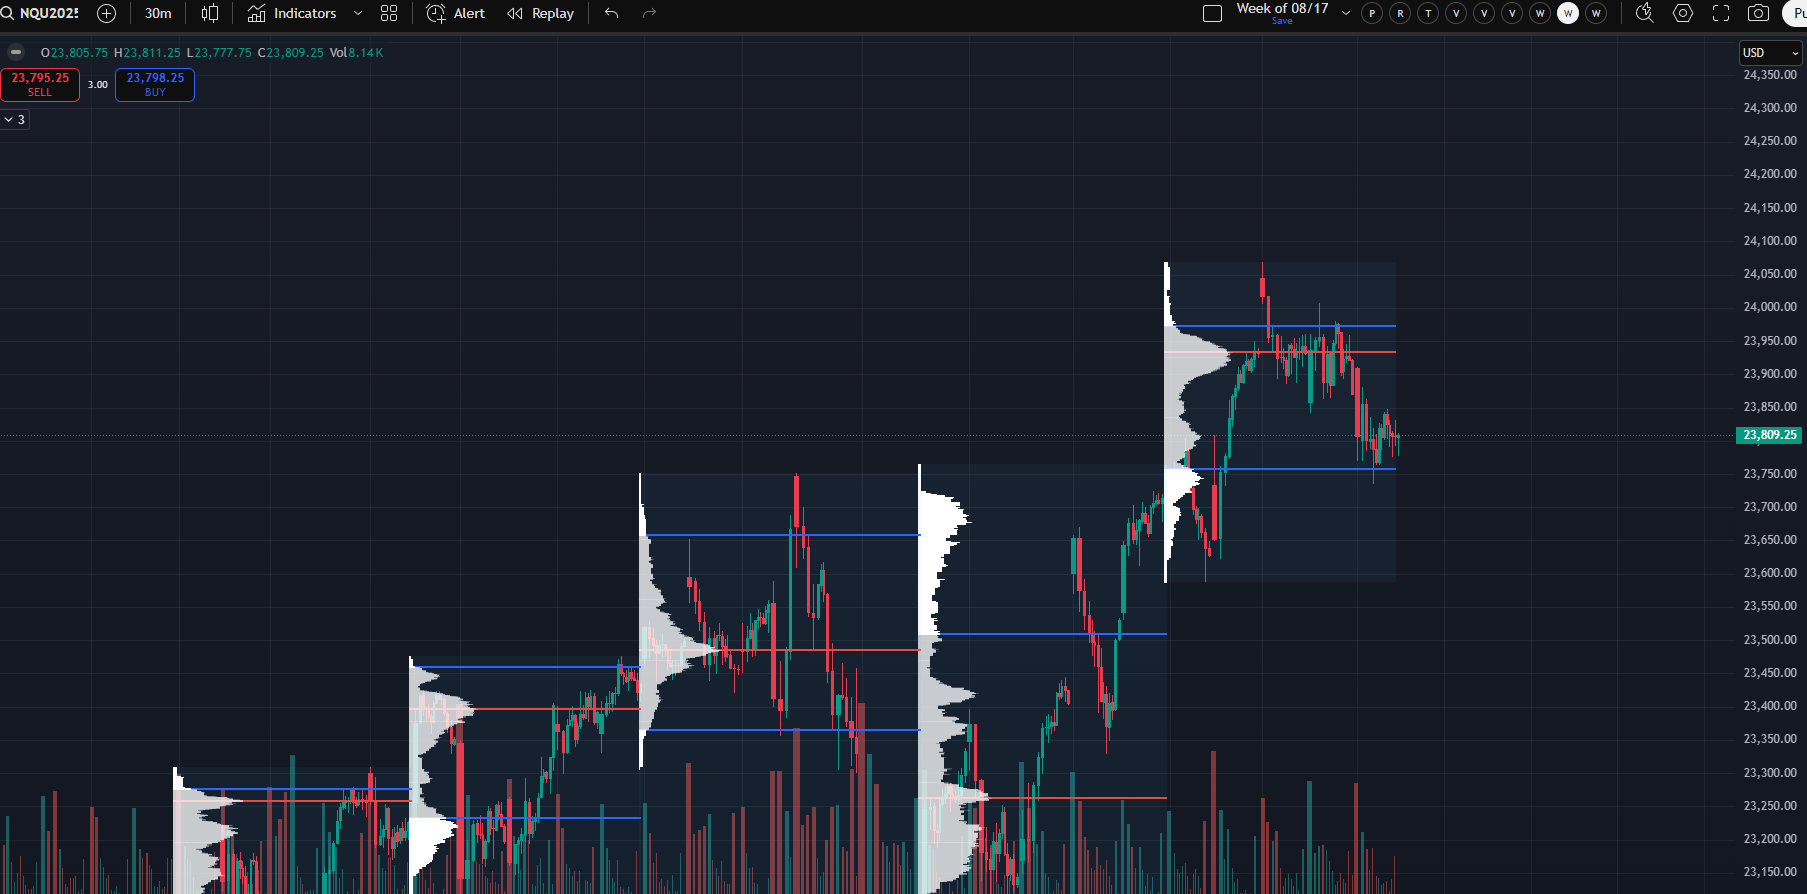
Value on the weekly profile completely gapped higher relative to any prior week (an RTH only chart):
We obviously didn’t come close to taking out last week’s low and given the above we are nowhere near able to call for any kind of intermediate time frame trend change. The order of business, therefore, is seeking a daily higher low. Perhaps Friday was it, and perhaps we get a deeper pullback, but either way buyers have another 1000 handles to find one.
In the bears’ column, we have a very good cash hours excess all-time high with a subsequent excess high following it. Additionally, as of now, the volume from this past week’s primary distribution (the one containing the volume point of control) is trapped overhead.
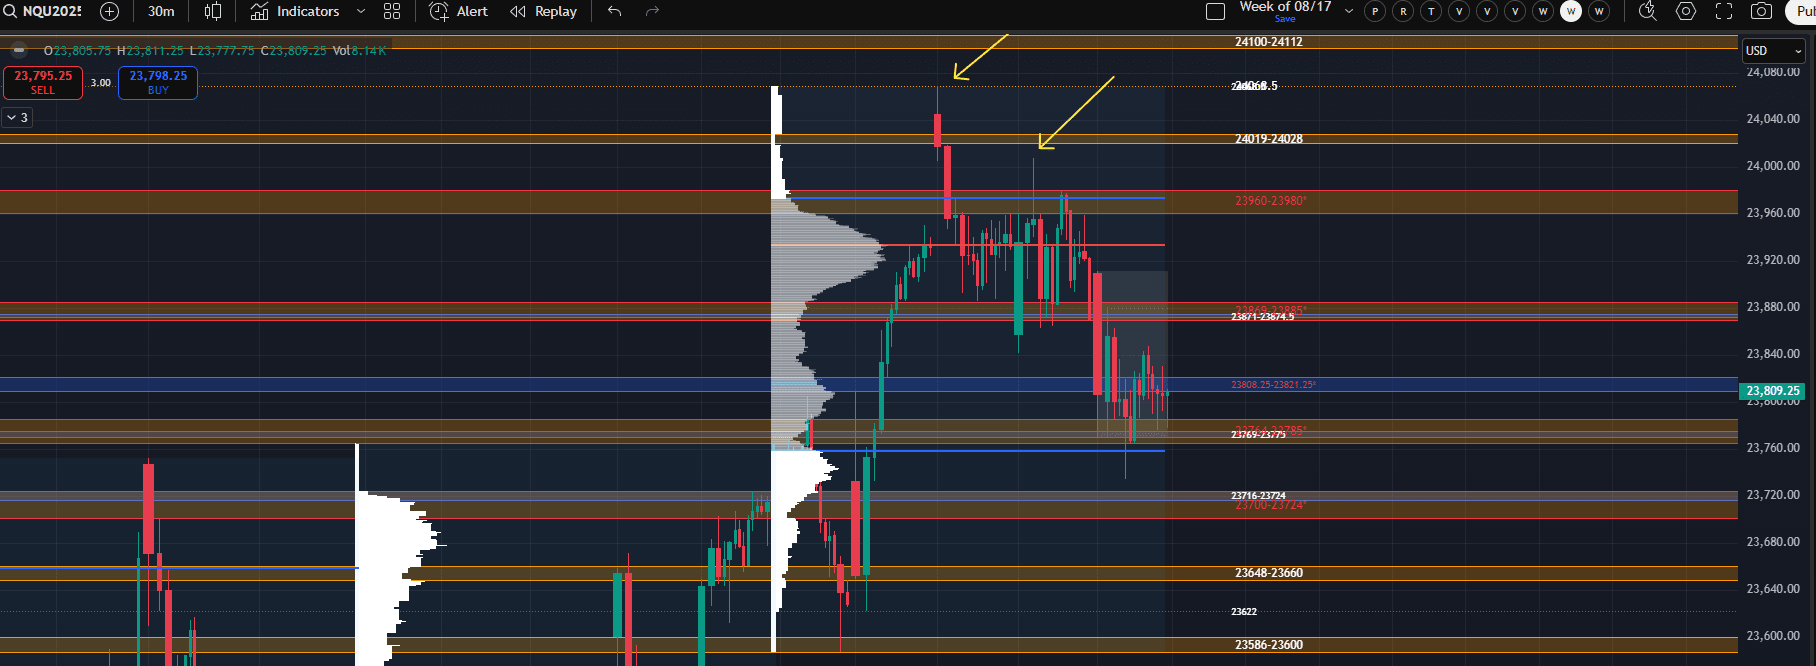
Going back to the first picture but zoomed in on the profile on the right, which shows volume since this current ATH:
Note that following the excess highs, the volume in the primary distribution was rejected from below and sellers built volume lower. This is a good start, but there is much to prove for sellers.
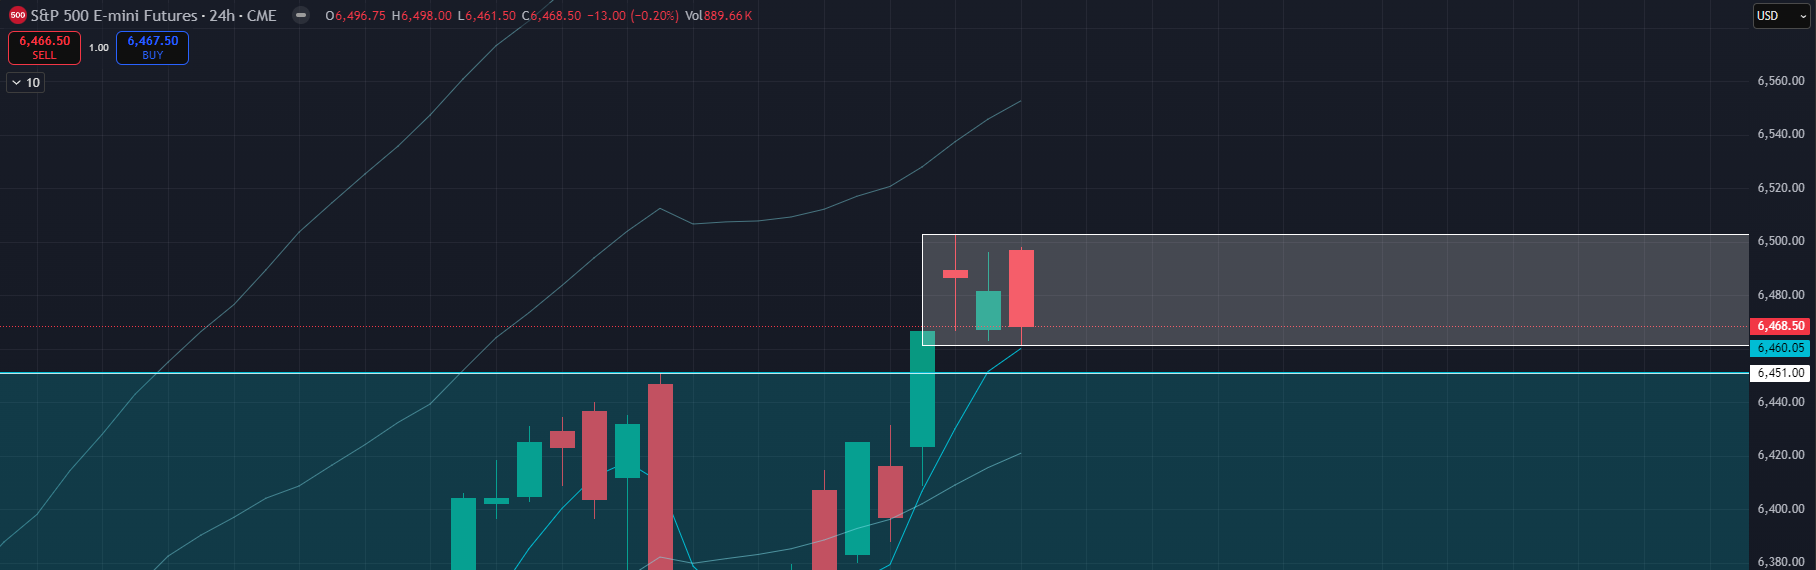
The ES picture is less bearish than NQ (which wasn’t bearish but had some characteristics in sellers’ favor). As gross as today’s candle may have looked, this could easily just be a 3-day balance flagging mostly above Tuesday’s breakout and the rising 5-sma. Again a 24-hour RTH only chart:
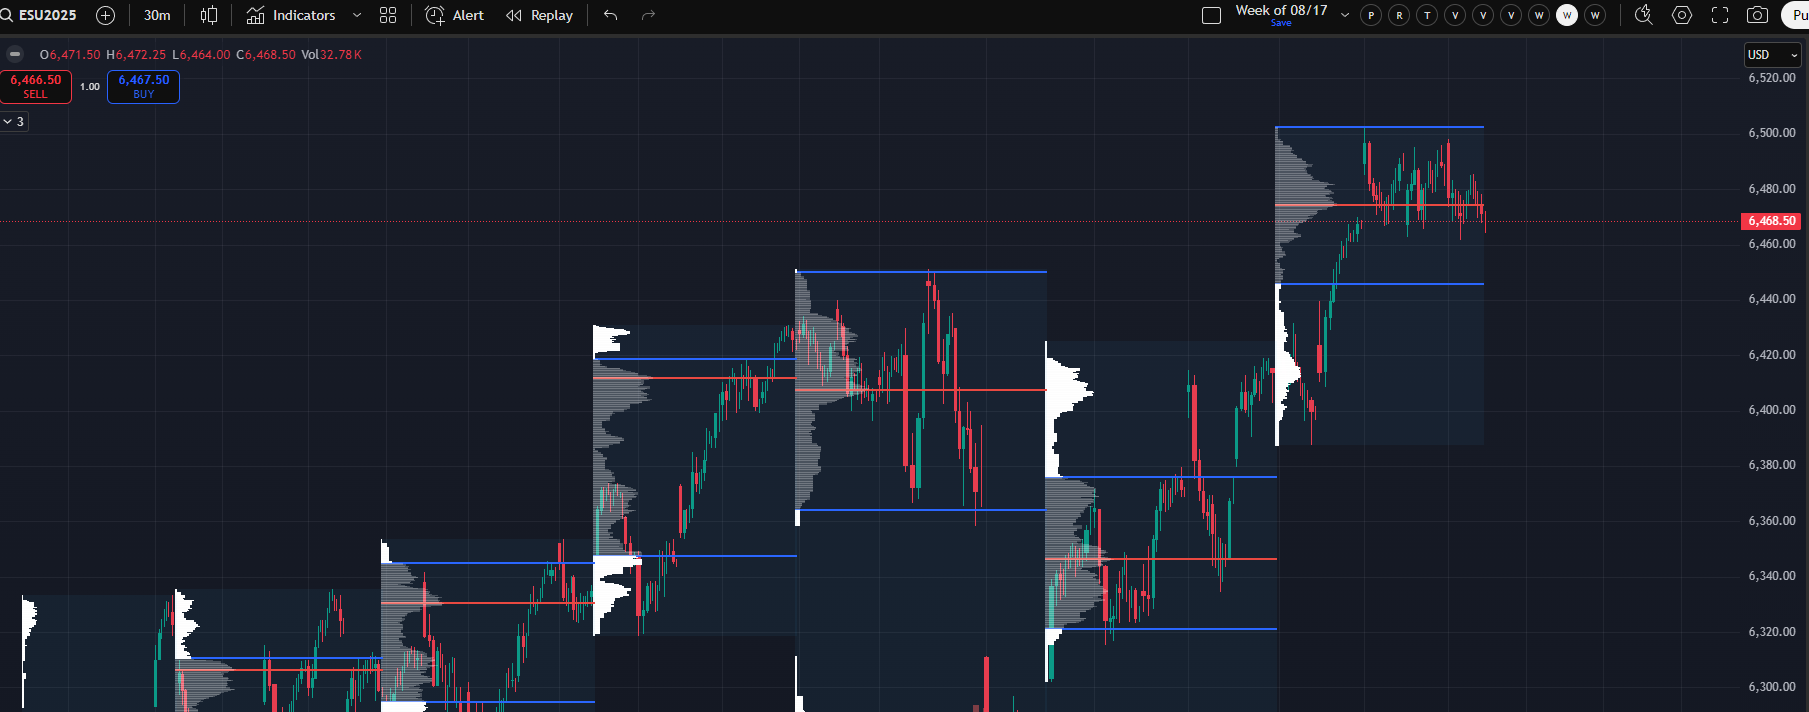
ES closed cleanly within its primary distribution at the top of this week’s range with value gapping higher relative to last week and nearly gapping higher relative to the July 27th week (an RTH only chart):
The below is the full hours chart. Note the ETH all-time high (blue arrow) and the successful back test of the July RTH high on the Thursday PPI print (yellow arrow)
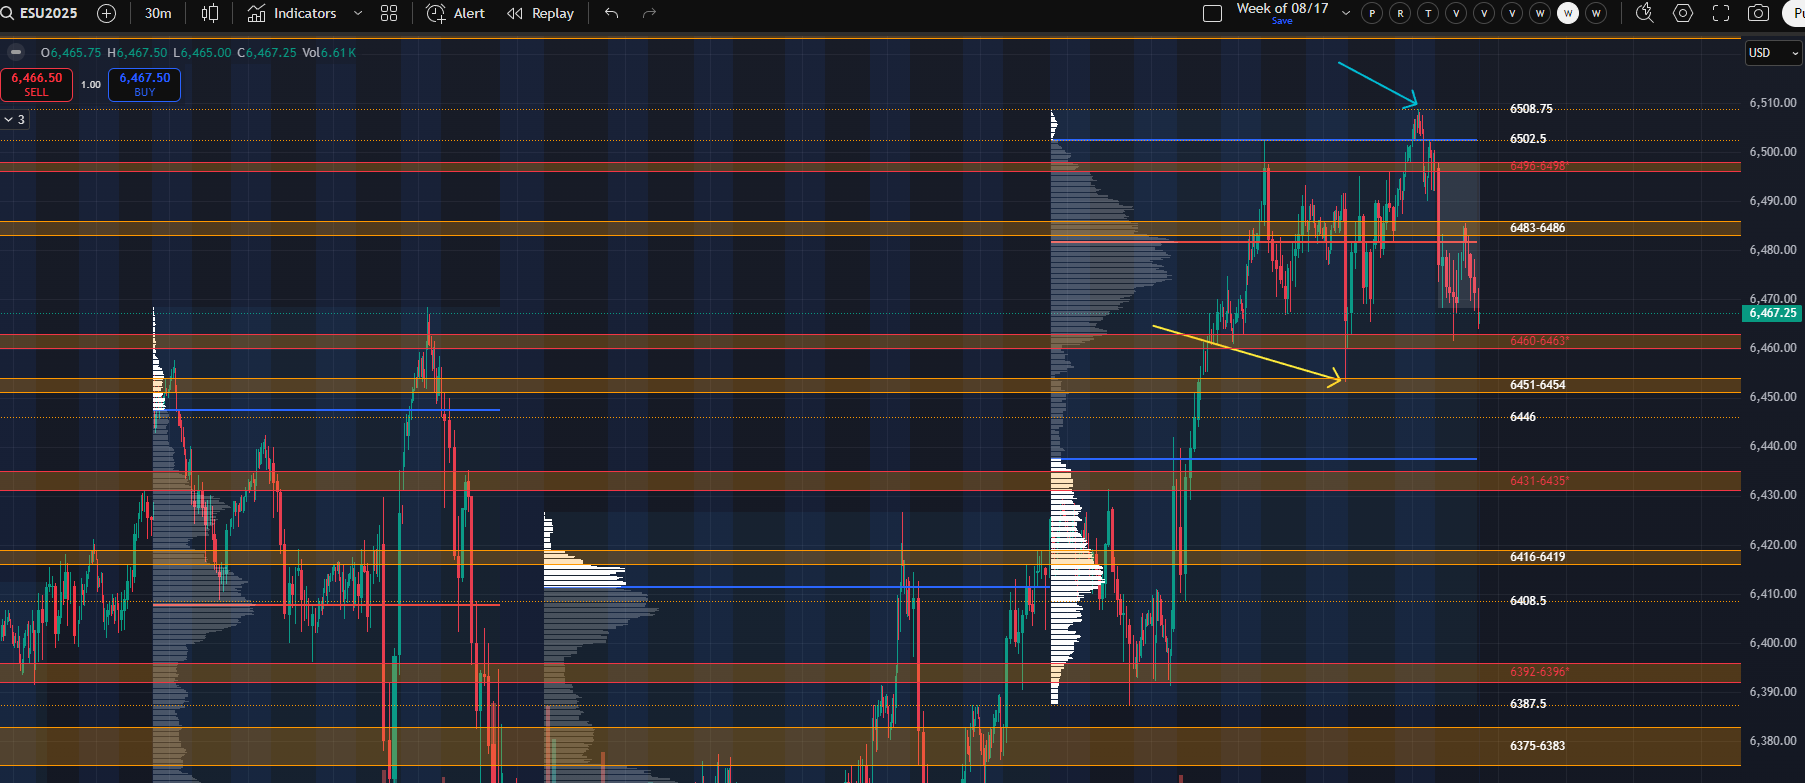
As long as the bottom of this recent range (I’m using 6460-6430) holds, including any kind of LBAF, I will expect a new all-time high to print in relative short order. This is therefore a weekly long setup and an A+ setup
A loss of the prior 6-week balance high, 6451, has potential to trigger weakness. However, I wouldn’t really be able to characterize it as a LAAF as we have since built significant volume higher (not to mention an ETH high). We must keep in the back of our mind that there is potential to see the bottom of that 6-week range but given the full context I will not make that assumption at this time. We will take it one week at a time and one day at a time to make these assessments.
Between the 6431-6460 I will be looking for potential traps which produce a LBAF of the 6460-6463 range. Note this would be a LBAF of the 3-day box I drew above and a LBAF of this week’s upper distribution. Again, this is a weekly long setup.
Sellers will need to produce lower highs and lower lows below 6431 and this past week’s low to have potential for an intermediate time frame trend change, and there are still daily higher lows to be had lower.
I would characterize the big picture rotations as thus:
6496-6498 < - >6460-6463 < - > 6431-6435 < - > 6375-6387 < - > 6311-6320
In words (and with general levels) this means a hold of 6460 (including Friday’s so we could simply rally directly) can retest 6496-6498, a loss of 6460 favors 6430, a hold of 6430 can retest 6460, a loss of 6430 can test 6380, a hold of 6380 can retest 6430, a loss of 6380 can test 6315, and a hold of 6315 can retest 6380.
As always, there are levels in between which can serve as traps and it is those we will spend the most time on for this week.
We have already tested the 6451-6454 range during the premarket PPI print, but this spot (or anywhere between 6451 and 6460) can produce a LBAF of 6460. I don’t recall if I mentioned it, but this is a weekly long setup targeting 6480s, 6496-6498, and new all-time highs. I’m happy for this thing to sell, but this is the opposite of what that would look like.
The 6446 level has a number of interesting reasons why it could also produce a LBAF of 6460-6463. This would be the same weekly long setup. It is safer to wait until price is firmly back in range before attempting it, but if a solid intraday setup allows for a lower risk entry I will look for it directly to have a better reward profile.
If price is trapped below 6460-6463 then I expect the rotation to 6431-6435.
A (cautious) weekly short setup would therefore be a rejection of 6460-6463 from below in the same way that on Friday NQ rejected 23880s from below. Watching NQ will very much give us clues as to what ES is going to do. If NQ finds continuation below Friday’s low, then ES is more likely to lose and reject 6460s from below. I would be cautious being too over-eager on this one and study the action from NQ this week ahead of time if considering it. We know that 6431-6435 would need to be lost for this trade to have any legs. I am more likely to treat it as a day trade (keeping runners if there is continuation) than attempting to swing puts, for example.
Below 6431-6435 I would consider anything in the 6400-6424 range as support, so I am very cautious initiating any shorts in that range on first pass. I’ve used 6408.5 and 6416-6419 as weekly levels and we will have daily levels in between. While a loss of 6430 can find a rotation to 6380 (from above) I will not assume this to be a quick and easy range to pass through. This range would need to be traded through with time and volume, remaining trapped below 6430, in order to see a move to last week’s low and below.
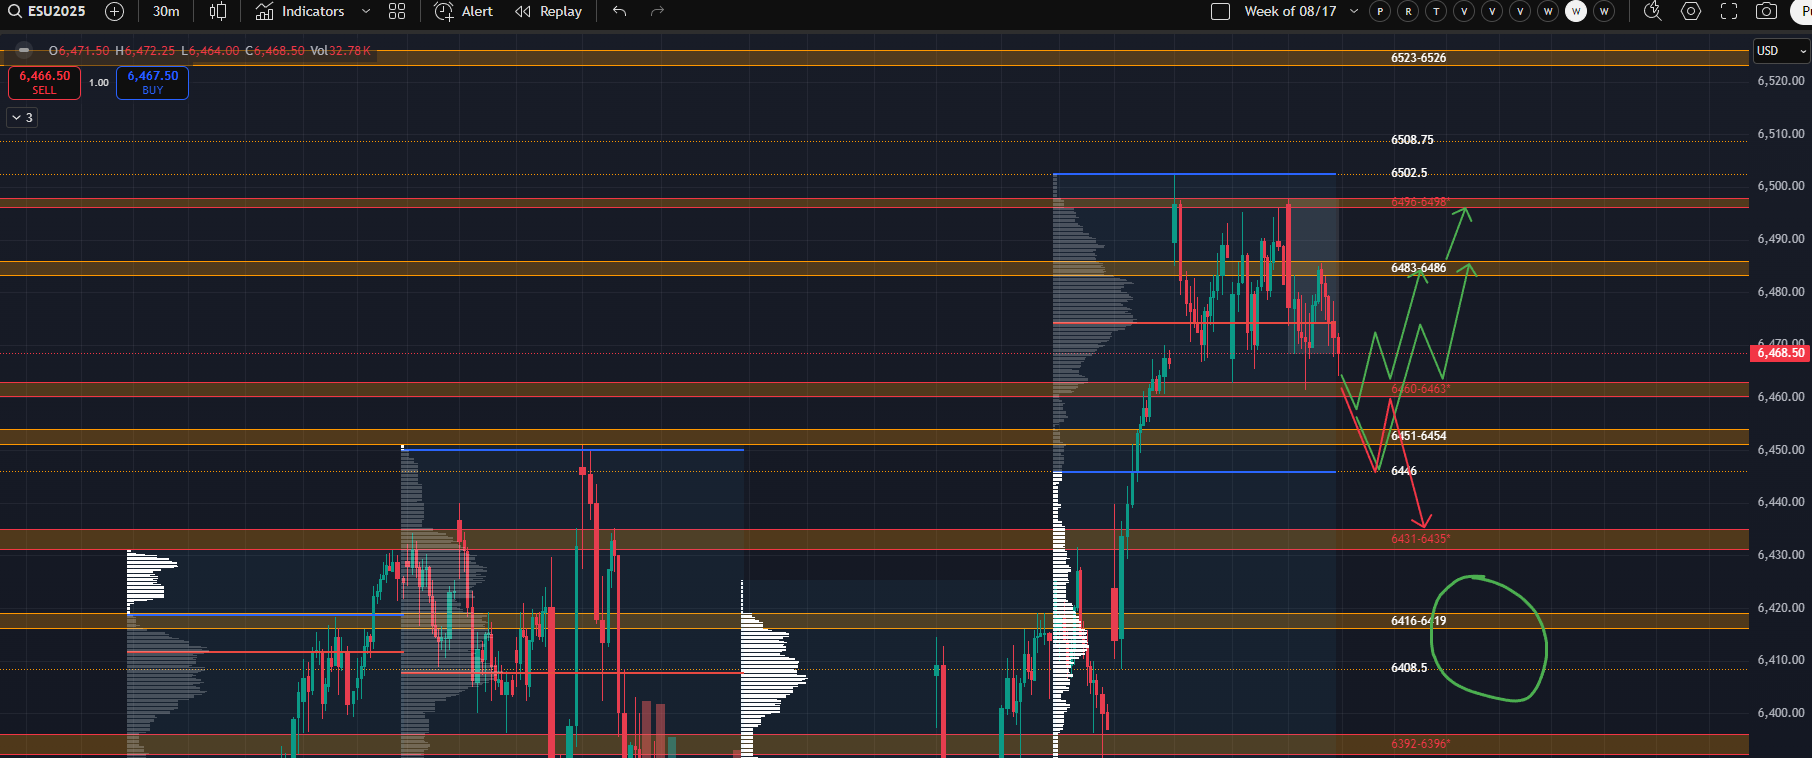
Here’s is a visual showing the LBAF long, the lower high short on a 6460 rejection, and a circle representing the general support area. Any other trades will need to be captured with the daily plans once we have more information:
I’ll add just one more thought for the plan as anything further could quickly be rendered moot by a LBAF of Friday’s low (or simply rallying directly off it on Sunday night). Perhaps the most bearish scenario for indices would be something like the following with NQ preserving its current excess high:
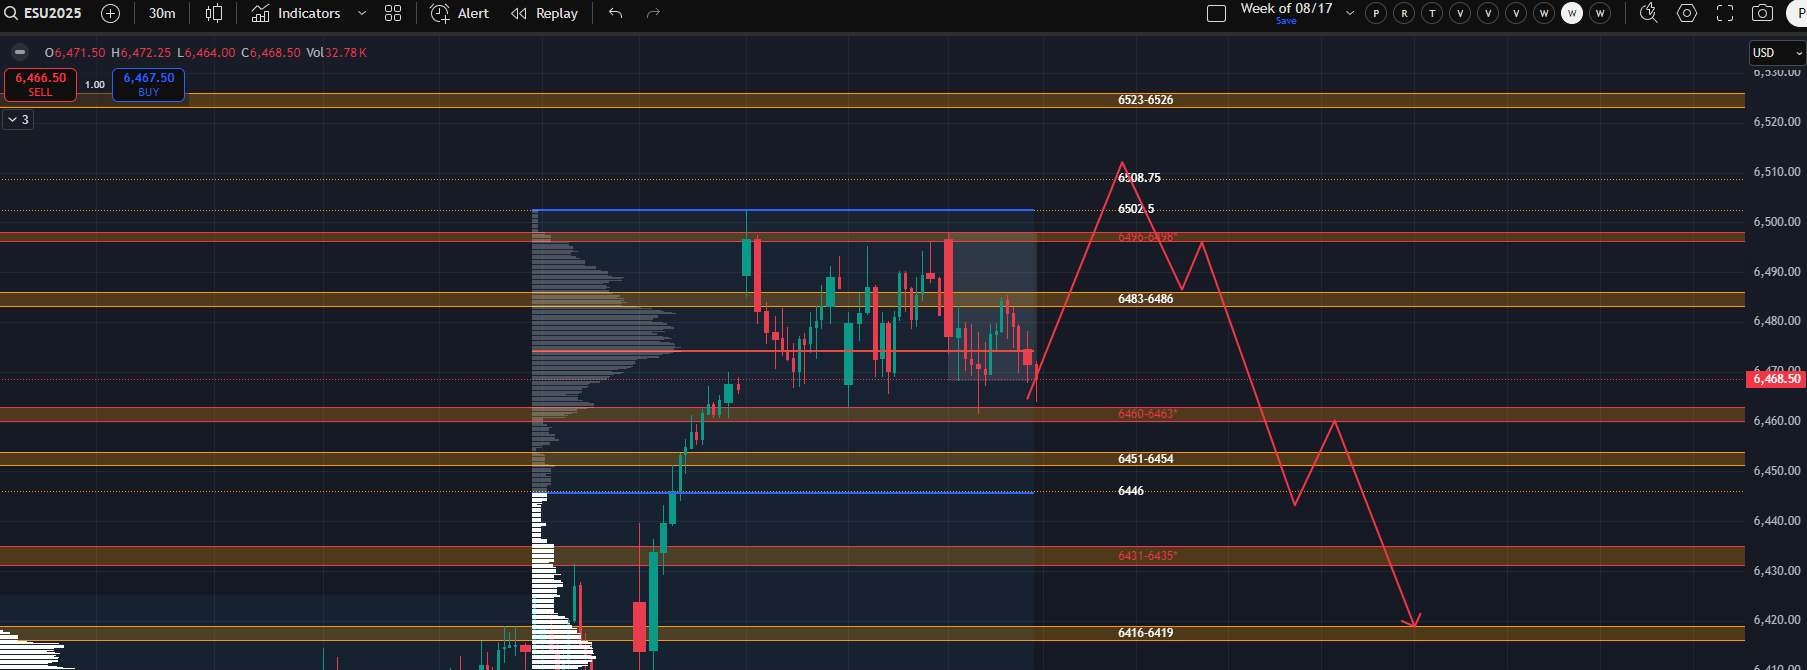
There really isn’t a ton of reason to speculate on this but given the concerns with NQ, IF we saw ES do the same and leave a proper excess RTH ATH followed by a loss of 6460, then I would have a higher level of confidence in downside continuation.
Good luck this week!