
[COPY] Market Analysis for The Week of 10/5
Return of the Trap Door Setup- paywall removed

If you are looking to join the Discord please see here: JOIN THE DISCORD Please email help@pharmdcapital.com if there are any technical issues. The daily and weekly plans are posted in the Discord so the Discord option includes Substack content, but a new Substack subscription does not include Discord access. There is a 15% discount with code CALVES15
Be sure you have read the Starter Kit, including the free section even if you’re a paid subscriber. Trading Doggy Style Starter Kit
There is a 7-day free trial available so feel free to use it to unlock the full weekly plan. Be sure to read/watch the starter kit first.
Hopefully you found last week’s free video with the levels helpful to your trading last week.
I will be out of town this week for a funeral. I will continue to have daily posts, but they may be out later and be shorter in length.
In this week’s post I spend a bit of time on what I call a “trap door” setup along with evaluation of what a “good” high does and doesn’t look like. Whether or not the trap door setup plays out, I hope you will at least find it to be educational.
PAID CONTENT BELOW AND IN THE DISCORD
If you aren’t in the Discord or otherwise don’t have the indicator script it can be found here: PharmD_KS Indicator.
If you are in the Discord please see the TV-Indicator room for the script.
Add it to your favorites and follow the instructions (copy/paste daily and weekly levels into the respective sections) and use the converter to SPY/SPX/QQQ if you like.
ES Levels/Ranges:
6908-6911
6885-6888
6863-6866*
6842-6845
6823-6826
6798-6801
6776-6780
6757-6760
6741-6744* monitor for LBAF
6716-6719*
6693-6697
6676-6680*
6650-6653*
6636-6640
6622-6624
6606-6611*
See last week’s levels for lower
NQ Levels/Ranges:
25655-25669*
25594-25607
25537-25550
25480-25493
25420-25432
25369-25382
25313-25325
25253-25269*
25210-25219
25157-25169
25091-25099
25035-25046
24969-24980
24911-24916
24890-24898
24869-24875*
24841
24750-24769*
24651-24669*
24553-24569*
24453
24369-24392*
24236-24248*
See last week’s levels for lower
COMMENTARY:
Note: I will be out of town attending a funeral this week. I will still publish the daily plans, but they may be briefer and come out at different times than usual. I will be far less active in the Discord (I’m usually in there 20 hours a day) but will try to have morning updates most days and pop in here and there.
The grind higher has continued after the shift back in 30-minute structure we discussed on 9/25 and last weekend. This concept should be carried forward for future pullbacks. Since April, every time we have seen a downtrend on a 30-minute timeframe, then shifted structure back to an uptrend we have seen a new high. If/when sellers actually step in to produce a lower daily high (and then lower low) following a shift back to bullish 30-minute structure, we will have a change in tone. Until then, liquidation breaks are to be bought in my opinion.
Given we made a new all-time high on Friday, this will be another week where more of the focus is on potential downside. Not because there is anything bearish in price, but because upside is straight forward. Additionally, we actually do have a bit of a “trap door” setup on NQ in particular. While perhaps low probability (it seems like any kind of pullback has been) given the strength of this market, we are best prepared if we maintain awareness. Please don’t confuse outlining the possibility of a scenario with making a directional call. That said, I think the risks and probabilities are higher than normal here.
Before getting into what the setup is and what it would look like, note current location relative to the year-to-date VWAP +2 standard deviation band (again).
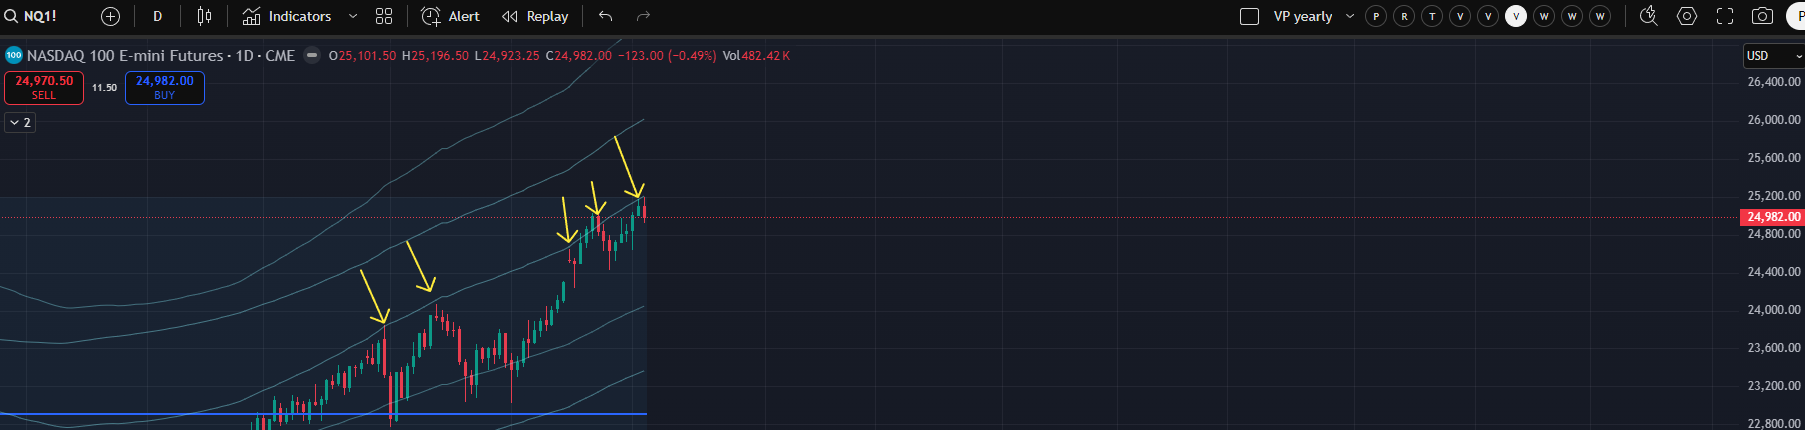
Additionally, QQQ has effectively reached a major extension from the August pullback.
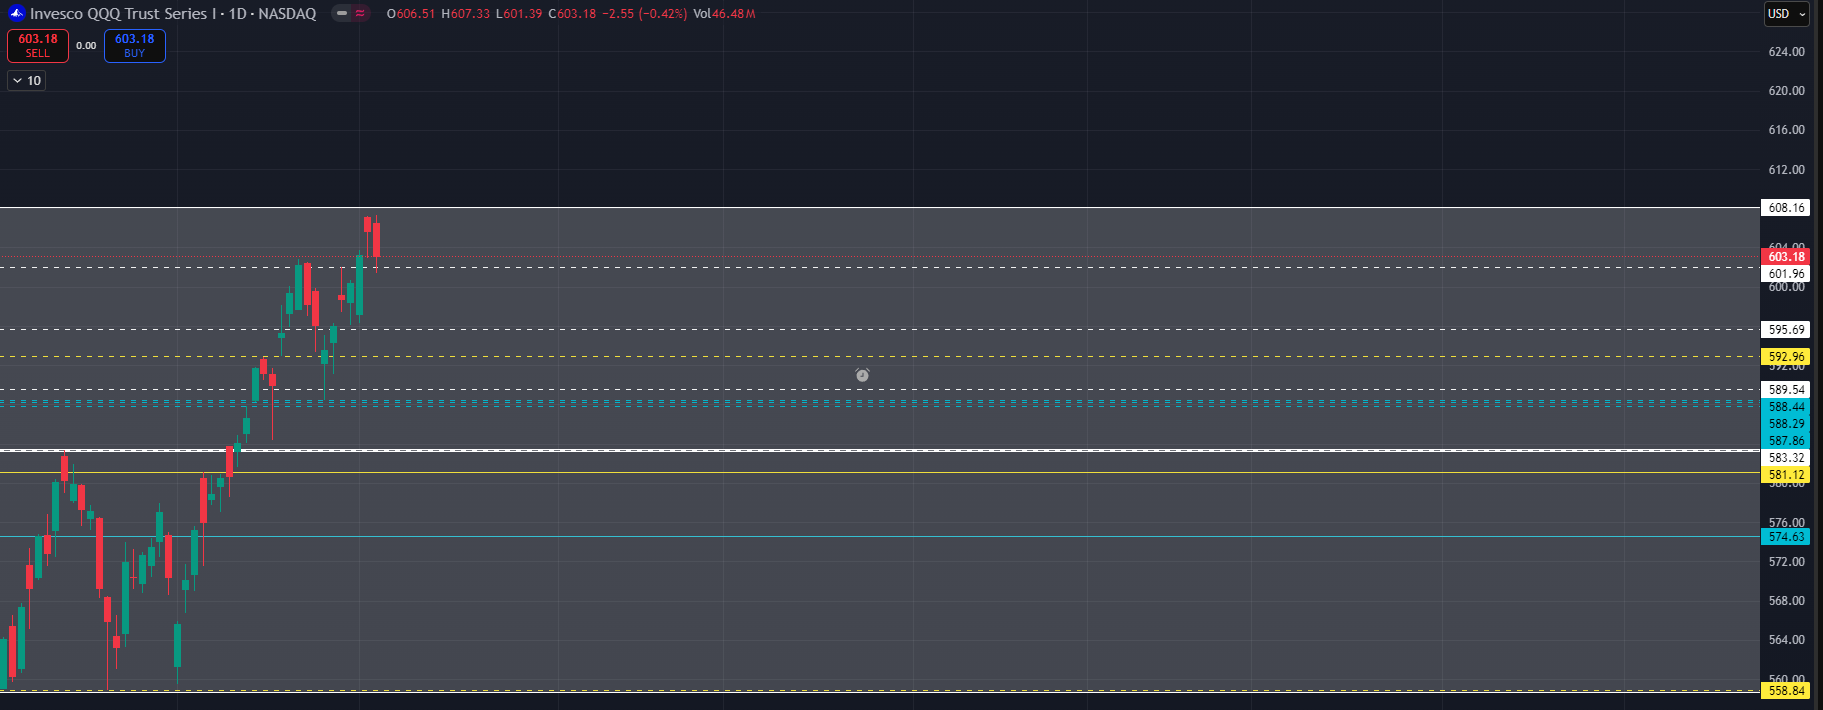
I also have a higher time frame NQ extension at 25253 in a similar area to 608.16 QQQ.
Thus far pullbacks off the YTD VWAP +2 have been shallow. It is very common in bullish years to grind into the +2 over a prolonged period of time before getting a liquidation and proper 4-7% or more) pullback.
Trap door setup:
If you’ve been a member since 2023, we’ve seen this setup play out a few times. It generally begins with a prolonged grind into the +2 YTD VWAP which leads to shallow pullbacks and what I call “stacked balances.” Effectively we get boxes that sit right on top of each other and even overlap a bit. The risk (in general) is that the loss of one box can trigger a test of the bottom of the next, which, if lost, can trigger a test of the bottom of the next. In such a strong market it is perhaps dangerous to operate under the assumption that this plays out to completion. We will discuss this further if/when it plays out. It is worth noting that we started monitoring for this setup two weeks before it played out in spring of 2024 so the concept can be carried forward regardless regarding this area.
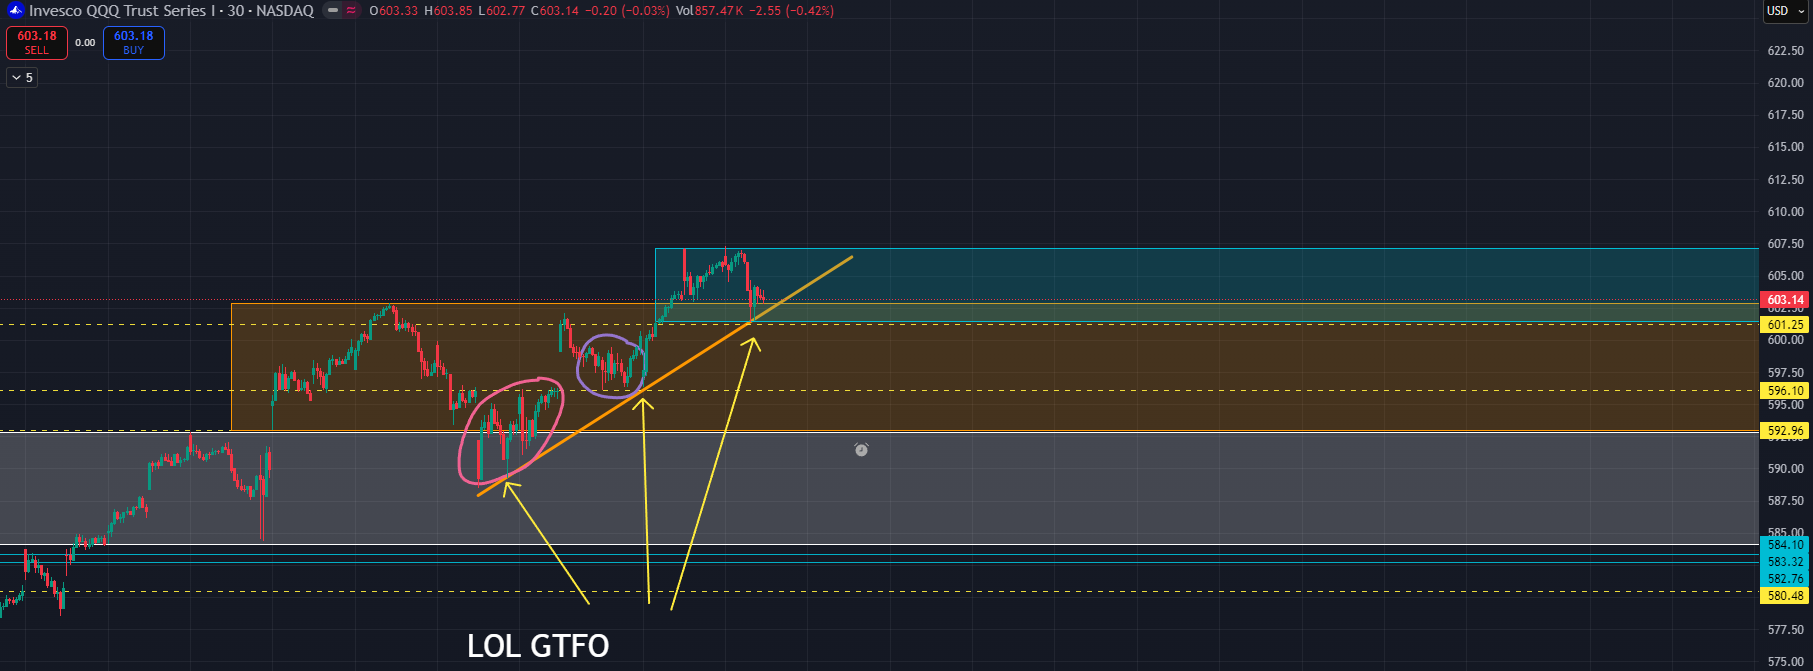
We have (thus far) a 2-day balance on QQQ from Thursday and Friday (blue box). This sits on top of the 5-day balance we monitored after FOMC (orange shaded). On 9/25 we got the LBAF (circled in pink) of this 5-day balance which held (and cleared) demand that was left behind from FOMC day (9/17) which had formed its own 4-day balance (white box). The purple circle represents the clearing of demand from the pink circle. Then there is the obvious trendline off the trap day low which is simply too perfect for me. Such perfect holds of a trendline are often a sign of shorter timeframe participants who have weaker hands and are readily liquidated.
Before you get too bearish, or alternatively annoyed by the prospect of price going lower, remember that liquidations (of longs) strengthen the market. It gives fresh stronger hands a chance to enter at better prices and removes overhead supply from weaker participants (having liquidated their positions they don’t remain trapped).
I don’t want to get too far ahead of things, but it very often ends up looking something like this (not intended to reflect any kind of time scale):
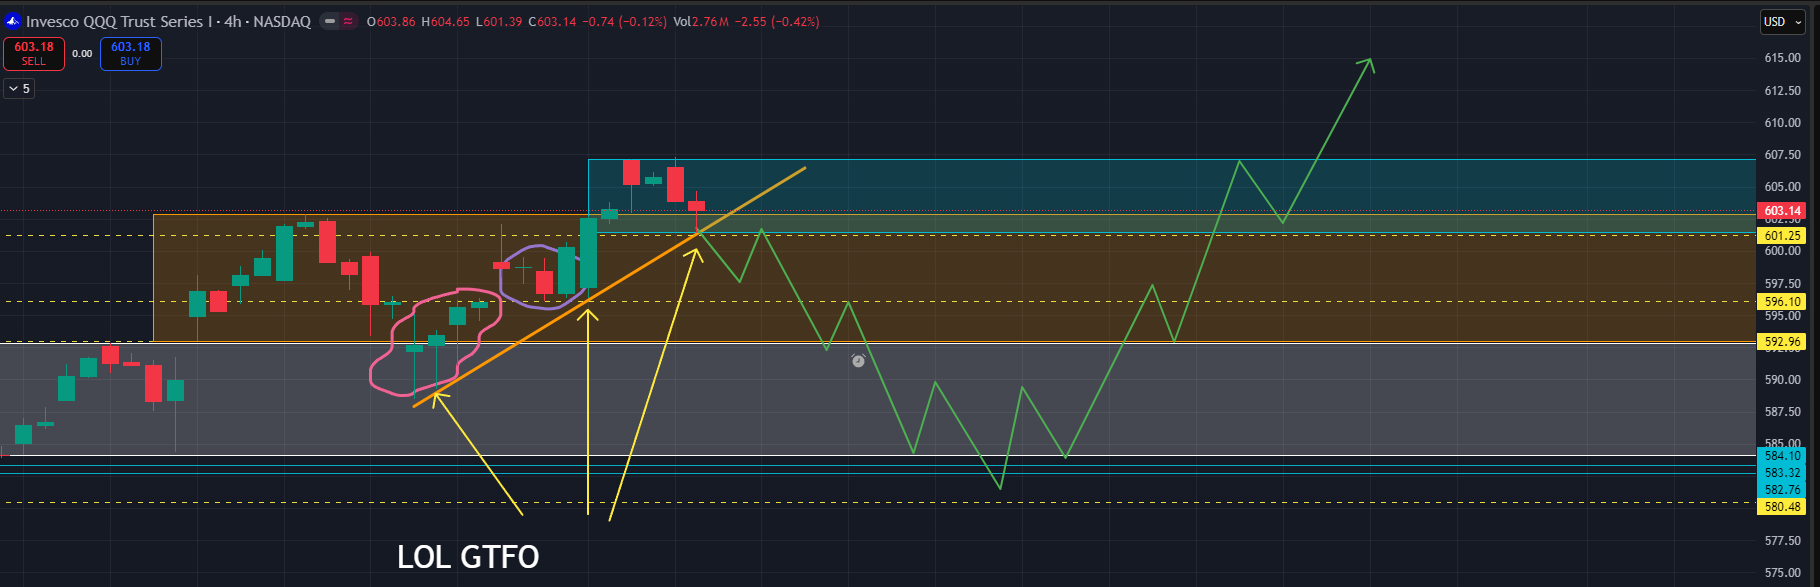
Keep in mind the blue box is only from two days so it could build out a wider (and higher) range. Regardless of whether or not this plays out, I hope you will consider it educational at the least.
The setup is far cleaner on NQ than it is on ES but ES would certainly come under pressure if NQ were to liquidate. It does have a somewhat similar setup.
One fact which should broadly temper significant bearishness (aside from the obvious trading near an all-time high) is the fact that NQ does not have a “good” high. It’s high was made premarket Friday and is relatively poor in character. A cash hours excess high (see the starter kit) would be a potential sign of the end of an upward move. I’ll use NVDA as an example of what a “good” high looks like. Note the consecutive excess highs on Thursday and Friday leading to potential acceptance back in the next distribution lower on last week’s profile.
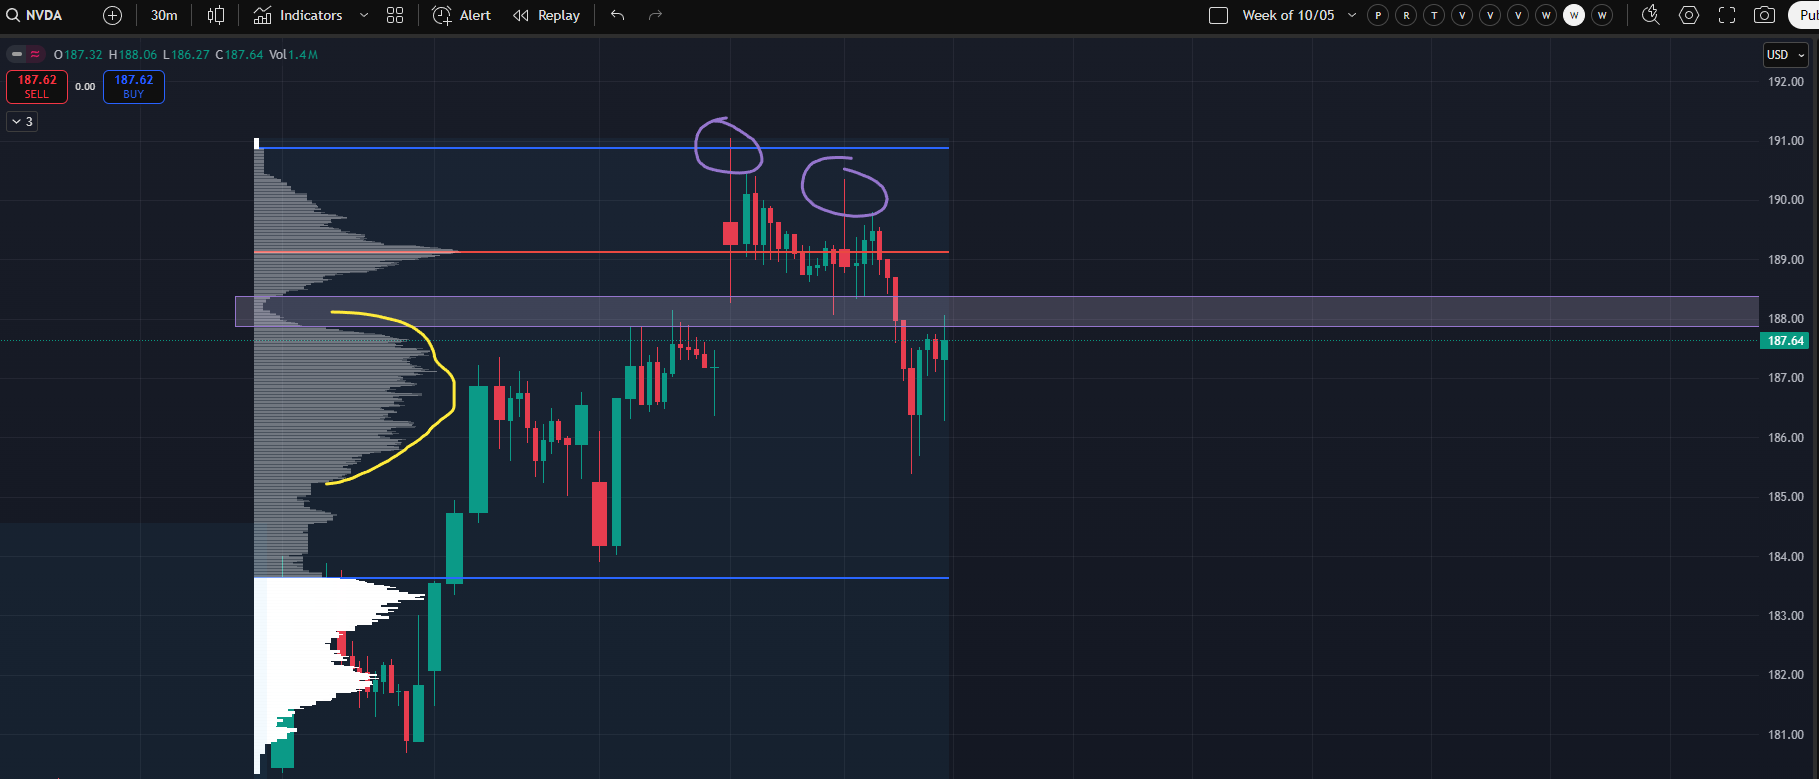
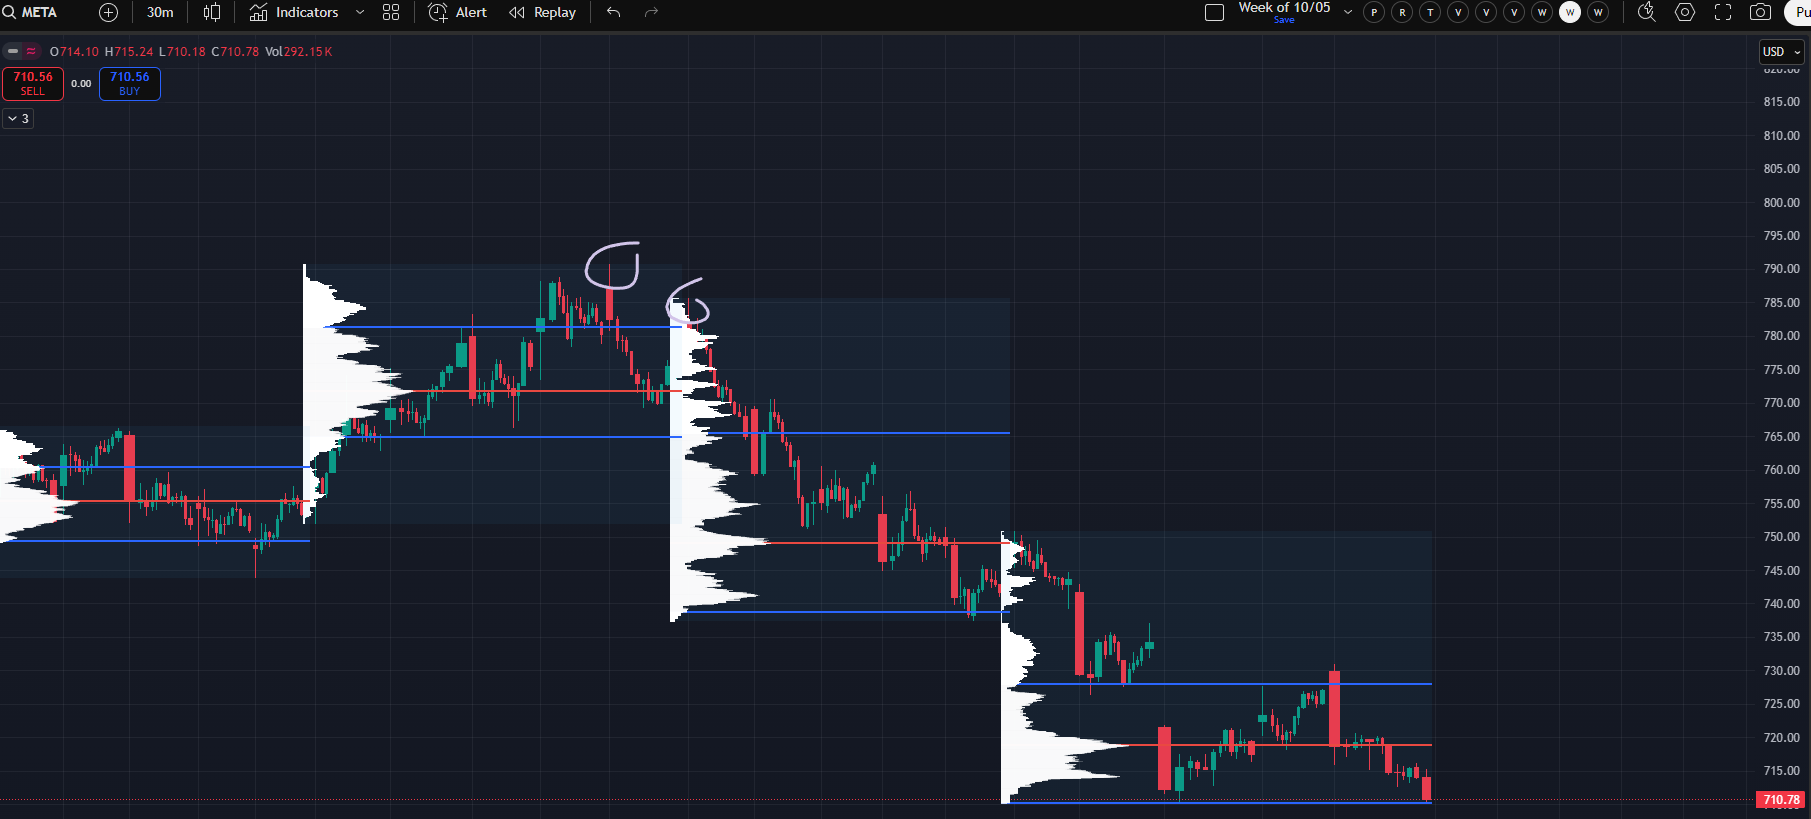
While an excess high on its own doesn’t make a top, this is precisely what a top looks like before it confirms. My point in posting this NVDA top excess high is of course simply to illustrate what is not present on NQ. META is another good example of a top sequence of consecutive excess highs that is simply not present on NQ.
Perhaps I’ll use TSLA as one more example for no reason other than to really drive the point about tops excess highs:
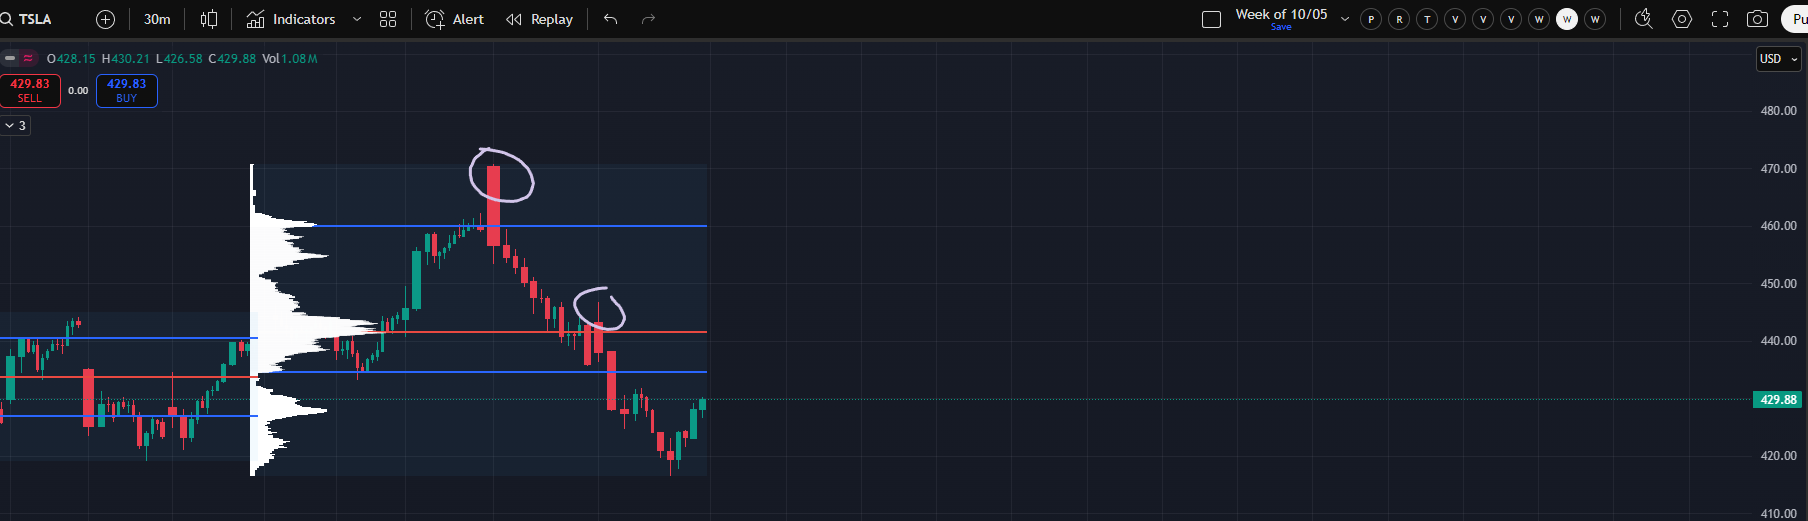
Okay yes, I’m amusing myself a bit on a Saturday, but it truly is a great opportunity to provide an example from “Simplifying Some Basic Auction Market Theory / Market Profile Concepts Part 1” and evaluate next to the NQ and ES highs.
Note the consecutive cash hours excess highs on NQ (purple arrows) BUT the relatively flat (non-excess) high made in premarket (purple circle). I am of course not a purist, but a cash hours excess high is always preferred when looking downward off an all-time high.
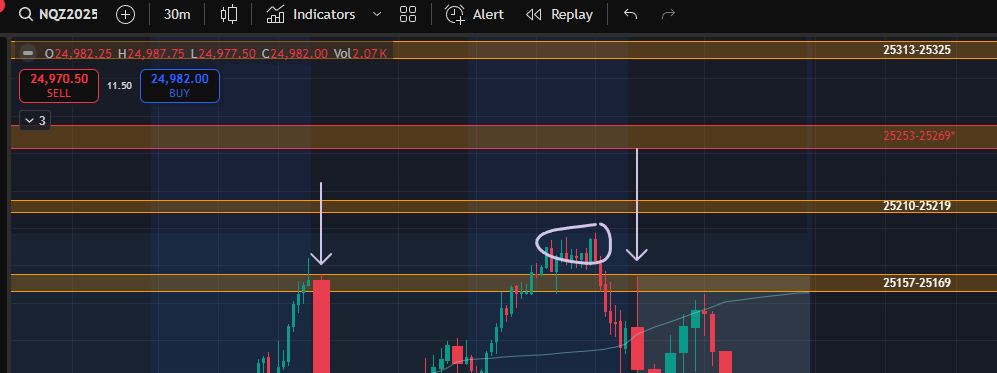
Also, the excess highs in and of themselves actually make a poor high on a daily basis as they are nearly identical from day to day (a cash hours only chart):
The ES high was made in RTH, but lacks any kind of spectacular material excess (compare vs the NVDA top high)
Regardless, especially since the increasing popularity of 0-dte options, we have seen plenty of “bad” highs lead to significant pullbacks. I’ll refrain from explaining why for now. This exercise is primarily educational as there is nothing really bearish in price, so it takes the place of discussing upside scenarios outside of targets.
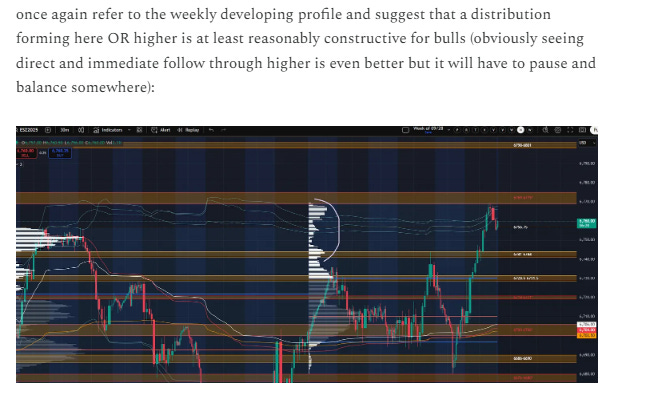
PRICE:
If you subscribe to and read the daily plans, recall the post from Wednesday night heading into Thursday I outlined locations at which it would be reasonable for ES and NQ to form an upper distribution on the weekly profile. For ES it was really anywhere 6741-6744 to 6769-6775 or higher and it did so, including shifting VPOC for the week into the new upper distribution.
For NQ it was ideally 969-980 but with allowances down to the weekly 911-916 range. It also did so.
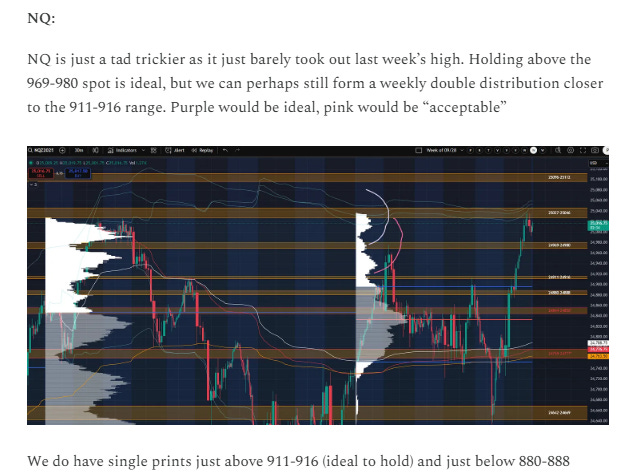
We note that NQ closed reasonably close to the bottom of that prescribed range and that Friday took out Thursday’s low.
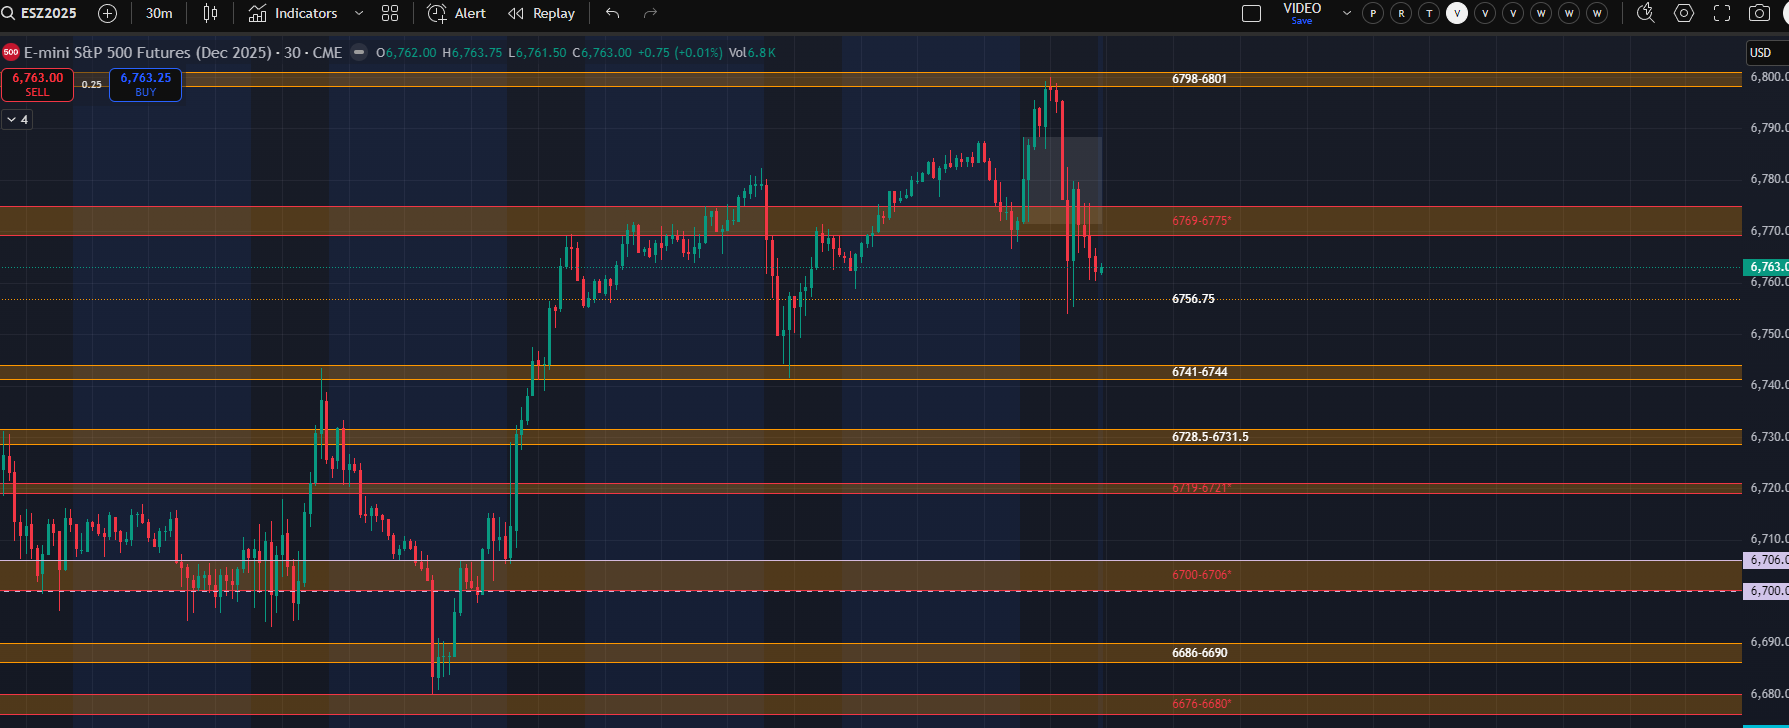
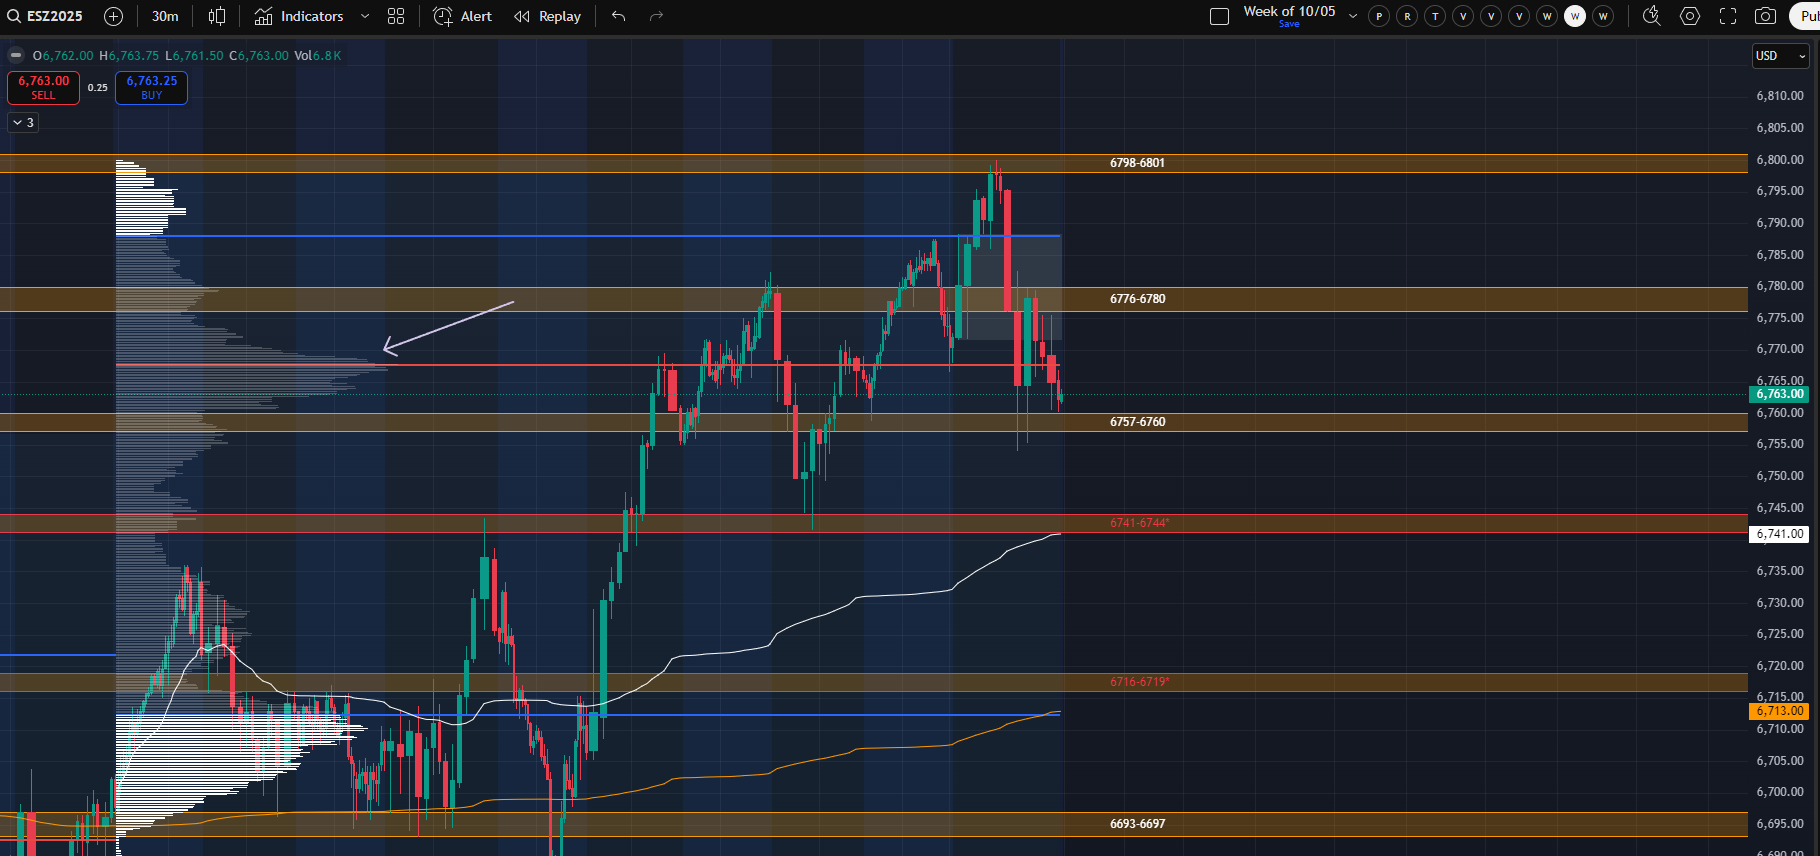
ES:
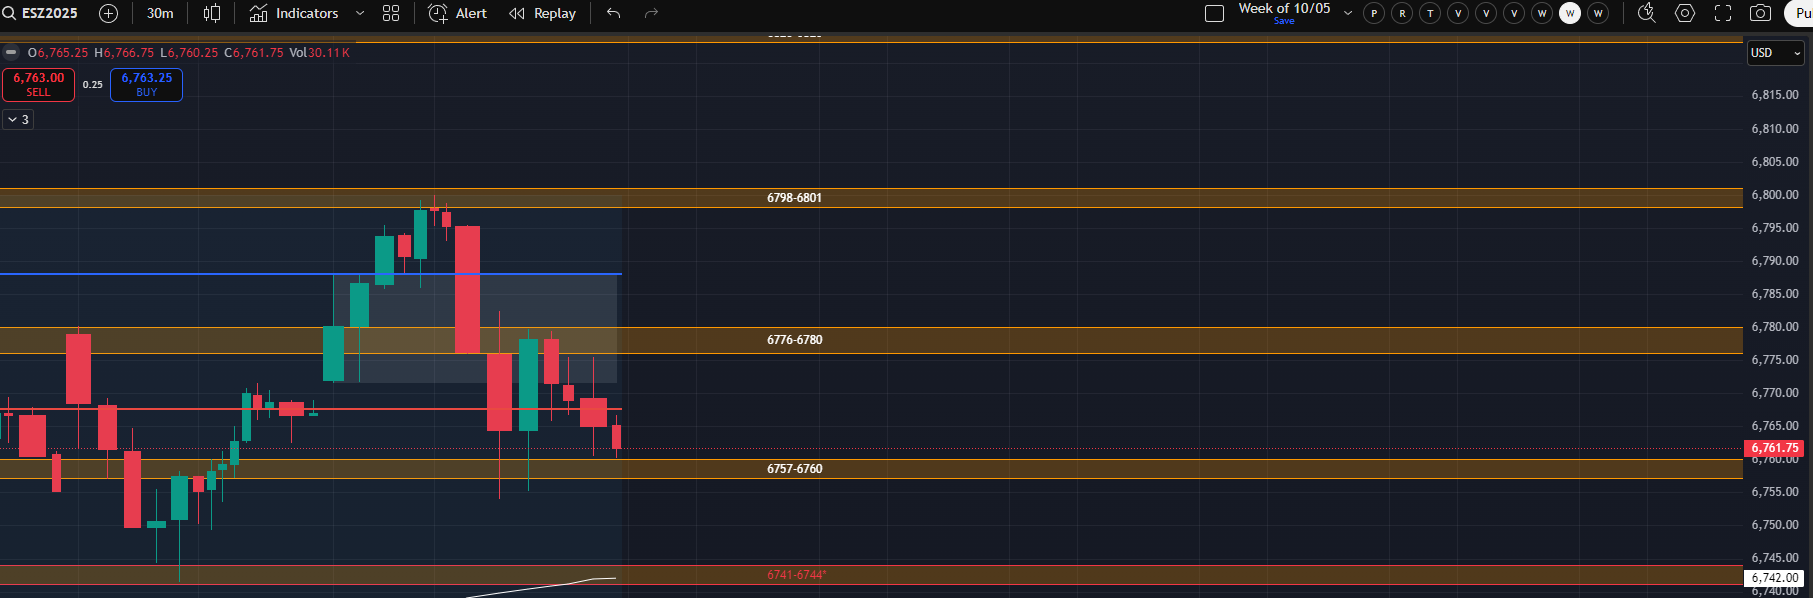
Holding 6757-6760 (with allowance for a quick LBAF of Friday’s low) would be ideal for bulls. ES did not take out Thursday’s low on Friday, and I believe remains broadly constructive for direct continuation above 6741-6744. There wasn’t a huge ton of volume put in above 6780 but filling out volume between 6741 and 6800 would be fine.
If we trade higher and sustain above last week’s high, then I would broadly be targeting 6863-6866. This would be subject to change if we end up with a LAAF of last week’s high and then take out a prior day low.
It is a bit of a warning sign that NQ took out a prior day low so soon after a break of the orange range from the QQQ chart. If ES were to take out Thursday’s 6741.5 low on Monday (especially with NQ taking out Friday’s low) then both indices would be in a 30-minute downtrend. We will have daily levels in the plan for Monday which could trigger a LBAF of either Friday or Thursday’s low. Given the strength of this market, perhaps that is all bulls need to avoid the trap door setup and rip to new highs.
Holding below (lower highs and lower lows) below 6741 would represent a 30-minute downtrend as mentioned above. The weekly 6716-6719 spot then becomes crucial to hold or last week’s cash hours low (6693) and potentially the ETH low (6680) comes into play.
Taking out last week’s low would bring the weekly timeframe into balance. If 6676-6680 is lost (I think we still need to monitor for a LBAF like last week) then 6650-6653 is really the only thing protecting the 9/21 week and 9/14 week lows (effectively the FOMC day low). Even seeing this low would just form a 4-week balance which we last saw August into September. Those weeks were hilariously all green through we took out a prior week’s low twice (using SPY to illustrate for the sake of simplicity).
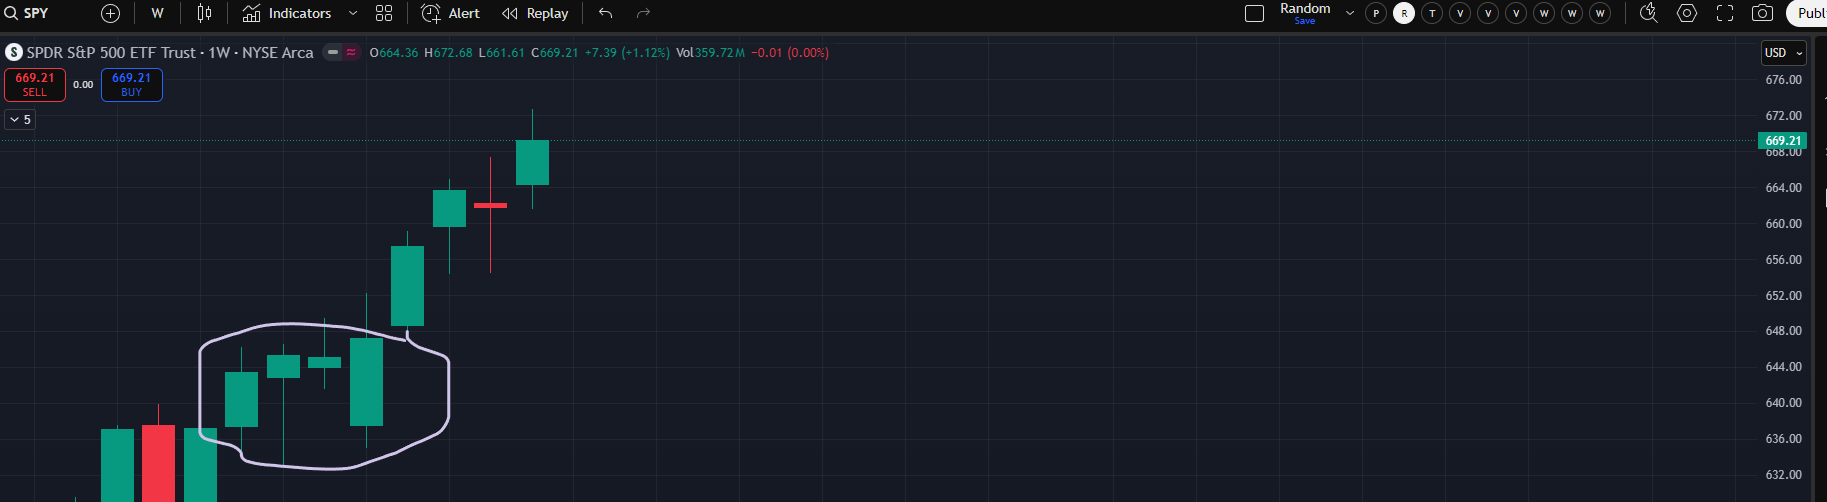
Note this 4-week balance broke to the upside and here we are.
Doing this again would present another juicy setup (most likely a long) which I’ll cover if it happens.
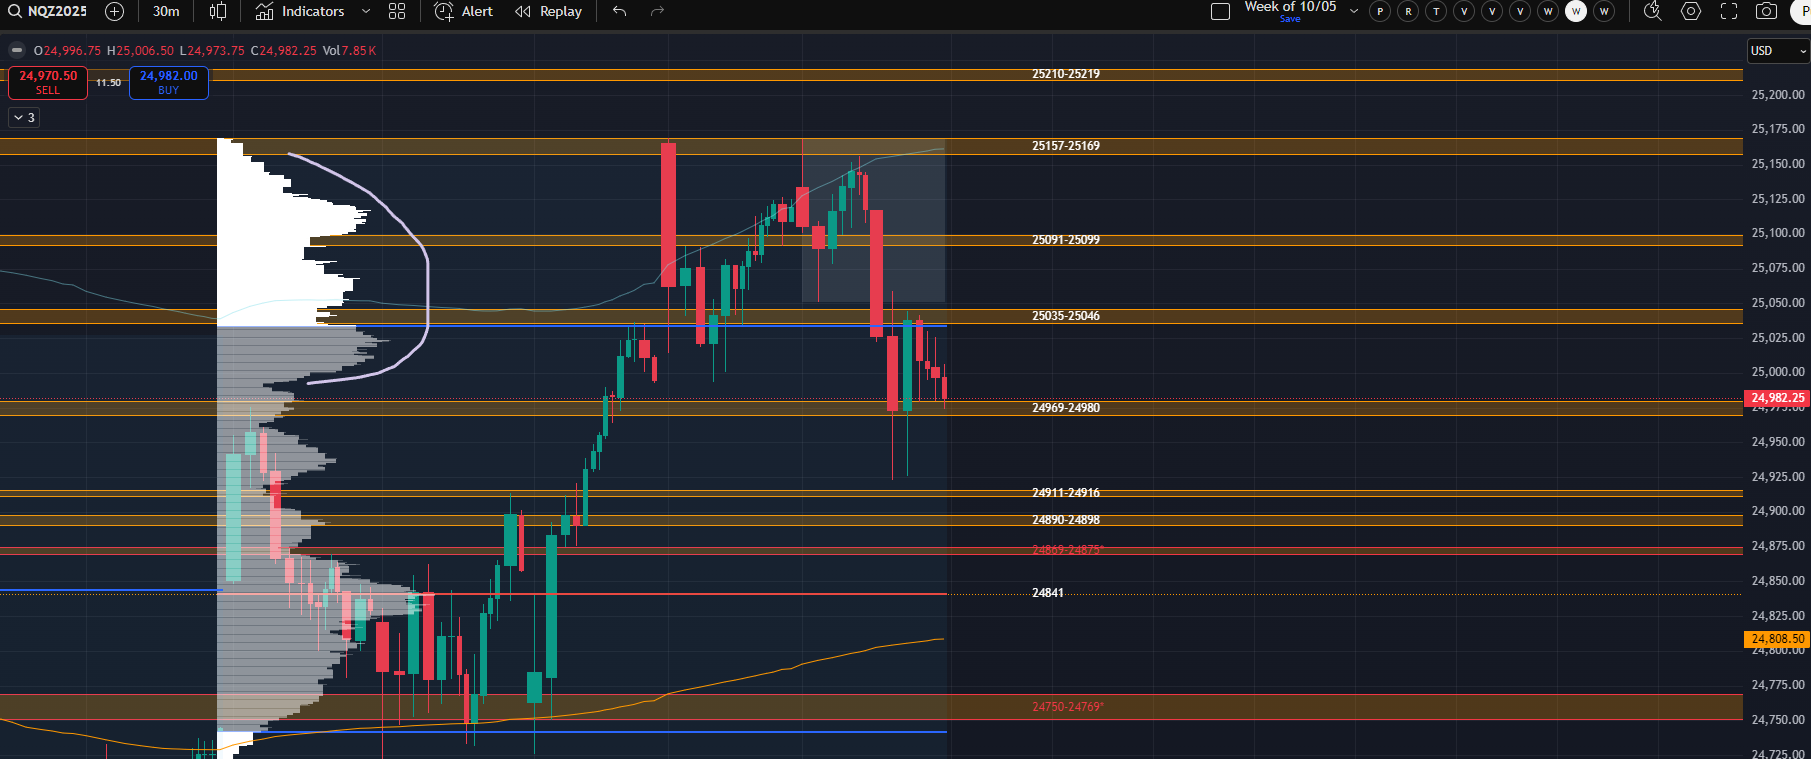
NQ:
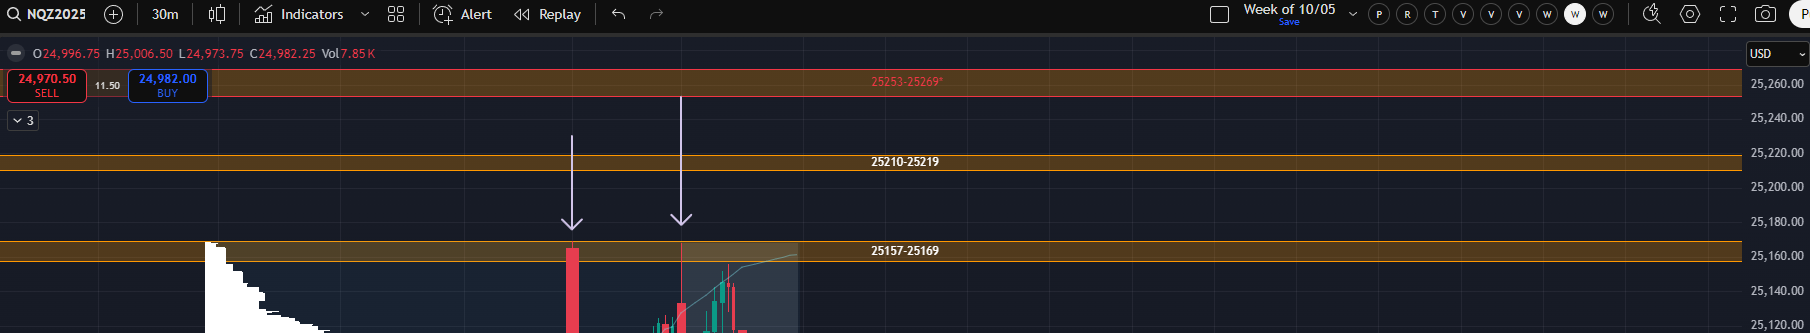
On Friday, NQ came down and filled most of the 24920.75-24928.75 single prints from Wednesday (low of day 923.25), holding just above the 911-916 spot. Just below there we have the demand that caused those singles and then the enormous B-period (10:00-10:30) single prints that really lit the move higher on Wednesday (24841.5-24874.75).
The ideal scenario for bulls is to trade higher immediately (holding 969-980) and reclaim 25035-25046 given NQ closed at the lower edge of last week’s upper distribution. I don’t necessarily see that as a clean path to a new high until 25091-25099 has been flipped back to support. Sustaining above last week’s high I would expect to see the 25253-25269 extension hit where I would exercise some caution.
Holding below 969-980 opens weakness. That said, the above outlines what sellers have to get through below and it isn’t trivial. I still think broadly holding 24911-24916 can be “okay” as long as a reclaim of at least 969-980 is quickly triggered.
I would expect the 3 weekly ranges in close proximity to the downside to be increasingly reactive, which is to say 24869-24875 (inclusive of a quick LBAF) has potential to be the strongest, then 24890-24898, then 24911-24916 in order of their strength. Because of this and the prevailing bullish trend, I would likely be looking (at least initially) for a LBAF of Friday’s low if we trade lower on Monday. We’ll cover this in the daily plan.
The bearish scenario really involves trading down to 841 to fill Wednesday’s single prints, making a lower high , and then completing a rotation to 24750-24769 and last week’s cash hours low (722.25).
Because of the above two paragraphs, I believe a move lower can (at least initially) be tricky to navigate. NQ would be in a 30-minute downtrend, but sellers have a lot to get through. If they do, then the “trap door” setup because significantly more likely. However, if any of those spots end up shifting 30-minute structure back to the upside back above Friday’s low then, well, you know what most likely happens.
I’ll leave it at that for this week and get started on Monday’s plan 🤝