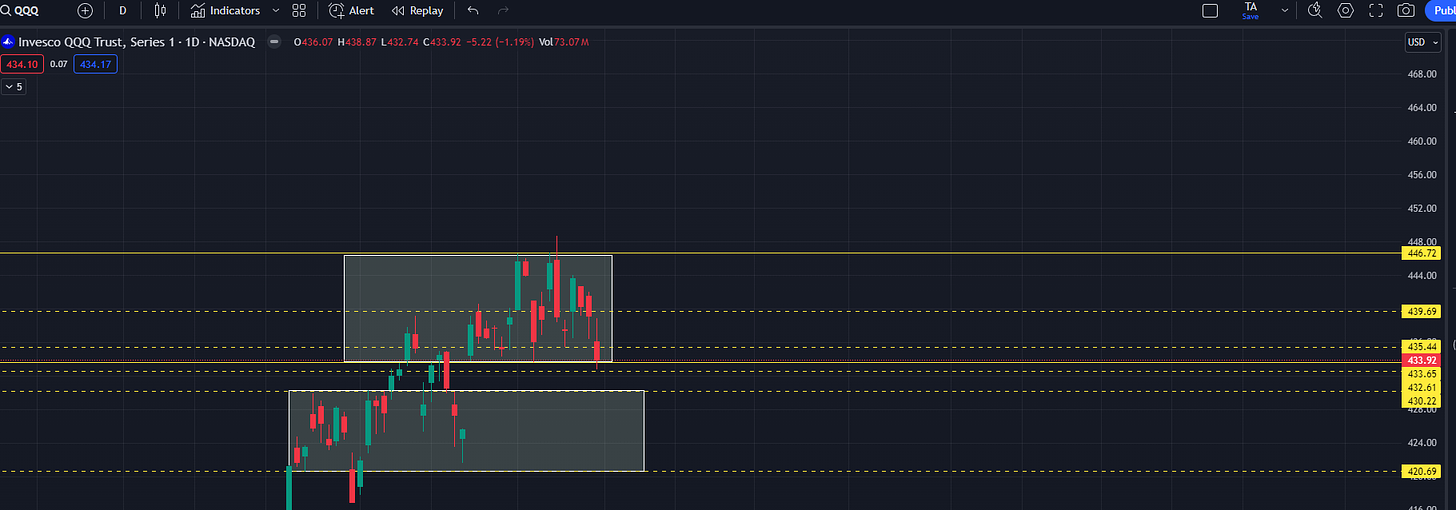
The box range from last weekend’s post and now:
Popped off the bottom of the box on Monday (no surprise) and sold back to and held the bottom of the box on Tuesday (best long opportunity for cash hours traders). Now faces a possible look above and fail of the range as of Friday. Monday will be important for buyers negate this weakness or risk working back down the box. I’ve added 443.66 as a level to watch on early weakness next week.
Like QQQ and SPY has pretty much been box consolidation to box consolidation with some overlap at the most recent. The boomer index certainly dropped the ugliest sequence Thursday and Friday in my book and looks poised to retest its recent box breakout. If it backtests directly from here then it may need to hold a second time after potentially stalling at the supply left behind from the Thurs/Fri sequence
SPY 0.00%↑ continues to hold its 20 sma and struggle with this ascending trend line and the +2 Bollinger Band acting as resistance. I’ve intentionally left off any bottom line drawn as a wedge or a channel because frankly I don’t think it matters. We have been monitoring these awkward overlapping box ranges that have come as a result of the continued grind into the aforementioned resistance. Ascending wedge or channel doesn’t really matter. Nothing truly bearish can happen until we break a balance (box) to the downside.
Drilling in a bit tighter for next week:
I’ll start with the bearish scenario which is rather far off for one week. If you’re long this market, you’ll know that longs are still valid unless this happens (disregard the time component it is the path in price that matters):
You can see this is a pretty far cry as of now but it is good to be aware of the possibility especially if long biased. Price getting trapped below 515.5-517.13 or so would be a required first step. Once could short a failure of 515.5 from below targeting 508.5 with runners for a continued breakdown. Stops would be continuation back above 517.13. I would be holding off on new long positions if this were to play out and would look for 508.5 to hold things together yet again, with stops on any continuation below it.
Any other bearish scenarios are minor counter trend trades occurring within a broader bullish context. These scenarios also work to facilitate good dip buys for those biased to the bull side. I’ve drawn 4 different paths that can perhaps be a bit confusing but the point is that any of these 4 spots can turn into a great long opportunity. We’ll call them 520.42-62 range (Wednesday close to Wednesday high), 519.5, 518.4, and 517.13. You can see how there can be some nice trades to the short side within these paths even if the ultimate resolution is bullish. The cleanest would be a hold of 520.42-62 or the hold of 517.3. The attempts at 519.5 and 518.4 could be tricky to navigate.
Which one will it be? I have no clue in this case, nor do I care to guess. What I do know is how to navigate into one of these trades in a manner that minimizes risk and maximizes reward. This is why I’ve left volume profiles on this picture. If you are not familiar with volume profile then disregard. I am working on completing a very basic introduction to volume profile that can really help to boost one’s traditional TA based trading. If you are familiar with at least basic volume profile, then this is the ideal situation that would occur:
If I find price intraday (especially late in the day) trading below value for the session (intraday sellers getting out of line) into one of these spots, then it is the perfect long opportunity. If you’ve at least seen some of my posts about the “late day trade” you’ll know why. These situations very often lead to at least reversion back within value for the day which would set me up with a green trade. I can take some small profits and then set my stops on the remainder for break even or just below and decide whether or not I want to swing it. It is also very often the case that such intraday traps lead to the biggest upside moves the next day when combined with a technical setup.
IWM 0.00%↑ is a bit of a mess. I would characterize 199.50-210 as “no man’s land” in between enormous balance (box) ranges. The breakdown from the upper balance occurred in January of 2022 as part of a 3-bar down sequence. The weekly doji from the week of 1/10/2022 (arrow) is acting as a bit of a gatekeeper between the 2 balances. I’ve labeled the key levels from this sequence. For further upside on IWM, price will ultimately need to base above 210.58 as firm support at minimum to open any further significant upside. Flipping 199.50 back to resistance could prove . . . problematic for Russell bulls. I would probably be very tactical with longs on IWM. If you’ve traded china names you’re probably familiar with the big moves and then lack of follow through. IWM can be a bit similar though perhaps not quite as bad.
Speaking of China, HSI is trying to form a bit of an inverted head and shoulders after holding the demand range I had posted on previously. The shoulders create the bottom of its current box consolidation. Downtrend resistance and overhead supply threaten a potential failed breakout of this pattern. I also don’t want to see price simply chop sideways long enough to “breakout” of this downtrend. I call that a “time walk” breakout and isn’t what a breakout should look like. I would want to see something more like the path I’ve drawn here to feel comfortable holding on to china names in size for more that a few days at a time.
TLT 0.00%↑ simply can’t get off the mat (no surprise given the macro). It has held 92 support yet again after failing to find bids in it’s prior box consolidation range. Even a higher high relative to December 2023 can fail right back down due to fresh supply from the box range. I see no reason to be long or short TLT as a single leg trade right now, but I do monitor on a daily basis for potential impacts on correlated markets.
UUP 0.00%↑ I haven’t updated my DXY chart in quite a while as I haven’t seen much reason to do so. After struggling repeatedly with that downtrend resistance the Thursday/Friday sequence looks like a legitimate breakout to me. 104.7 to 105.6 range could still prove problematic but basing above can retest 106-107 range and above there the air starts to get thin pretty quickly. I’ve redrawn the trend line (white) to be more conservative to give dollar bears a little hopium but I still prefer the orange trendline.
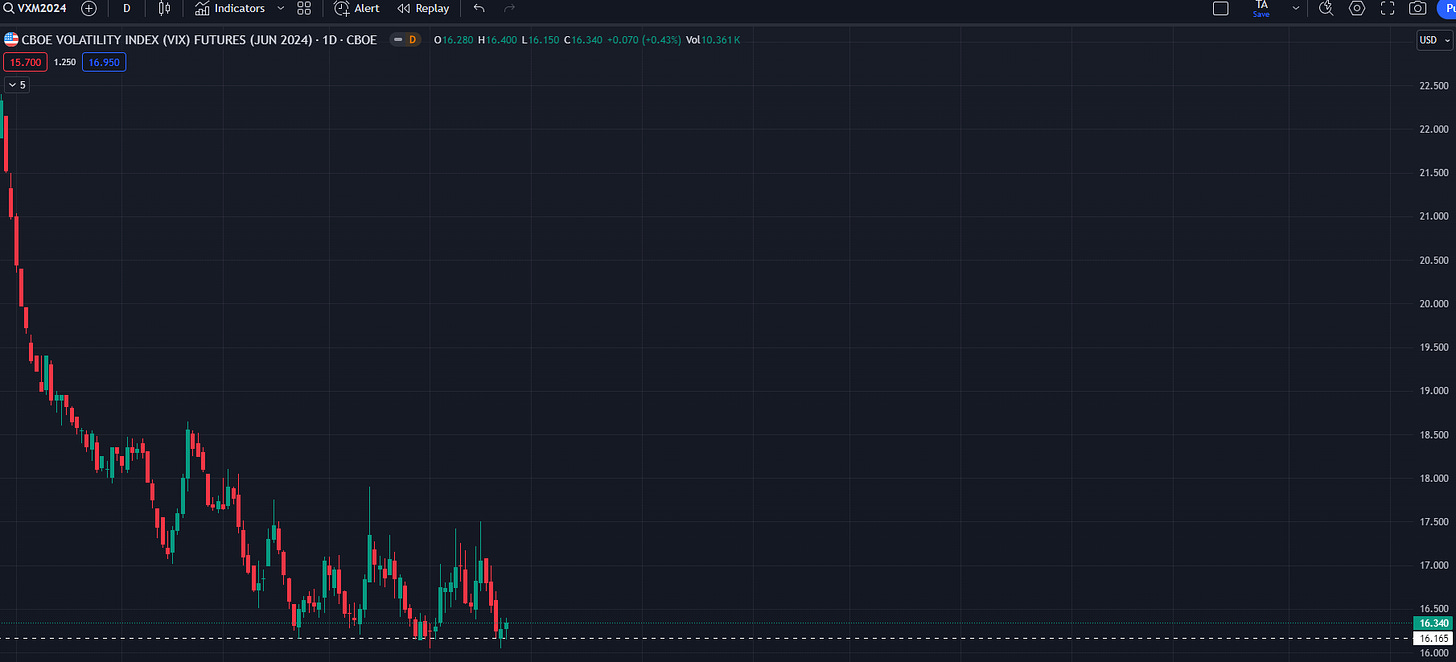
For volatility I’m still choosing to look at June VX futures which still isn’t quite ready to give up 16. There’s no real surprise as it is still pretty far out but it is worth watching


